Help & User Guide
Short, task-based answers. Every screen below is the real app.
Getting started
Sign up with your email + a password (or Google), enter your firm name, and pick a plan — both plans start with a 14-day free trial, no card required. You land on the Dashboard.
LedgerSwitch is built around one idea: an entity is one company's set of books. You add each client or group company as an entity, then view them one at a time or combined into a single group report.
How do I add a client's books?
Go to Clients and click Import CSV. This is the shipped way to get real numbers in today:
- Export a trial balance (or chart of accounts with balances) from QuickBooks, Xero, or any bookkeeping system as a CSV file.
- In the import window, name the company, choose its type (Client, Subsidiary, Holding, or Division), and pick your CSV file. There's a ready-made template to download if you'd rather start from that.
- Click Preview to check the columns were read correctly, then Import accounts.
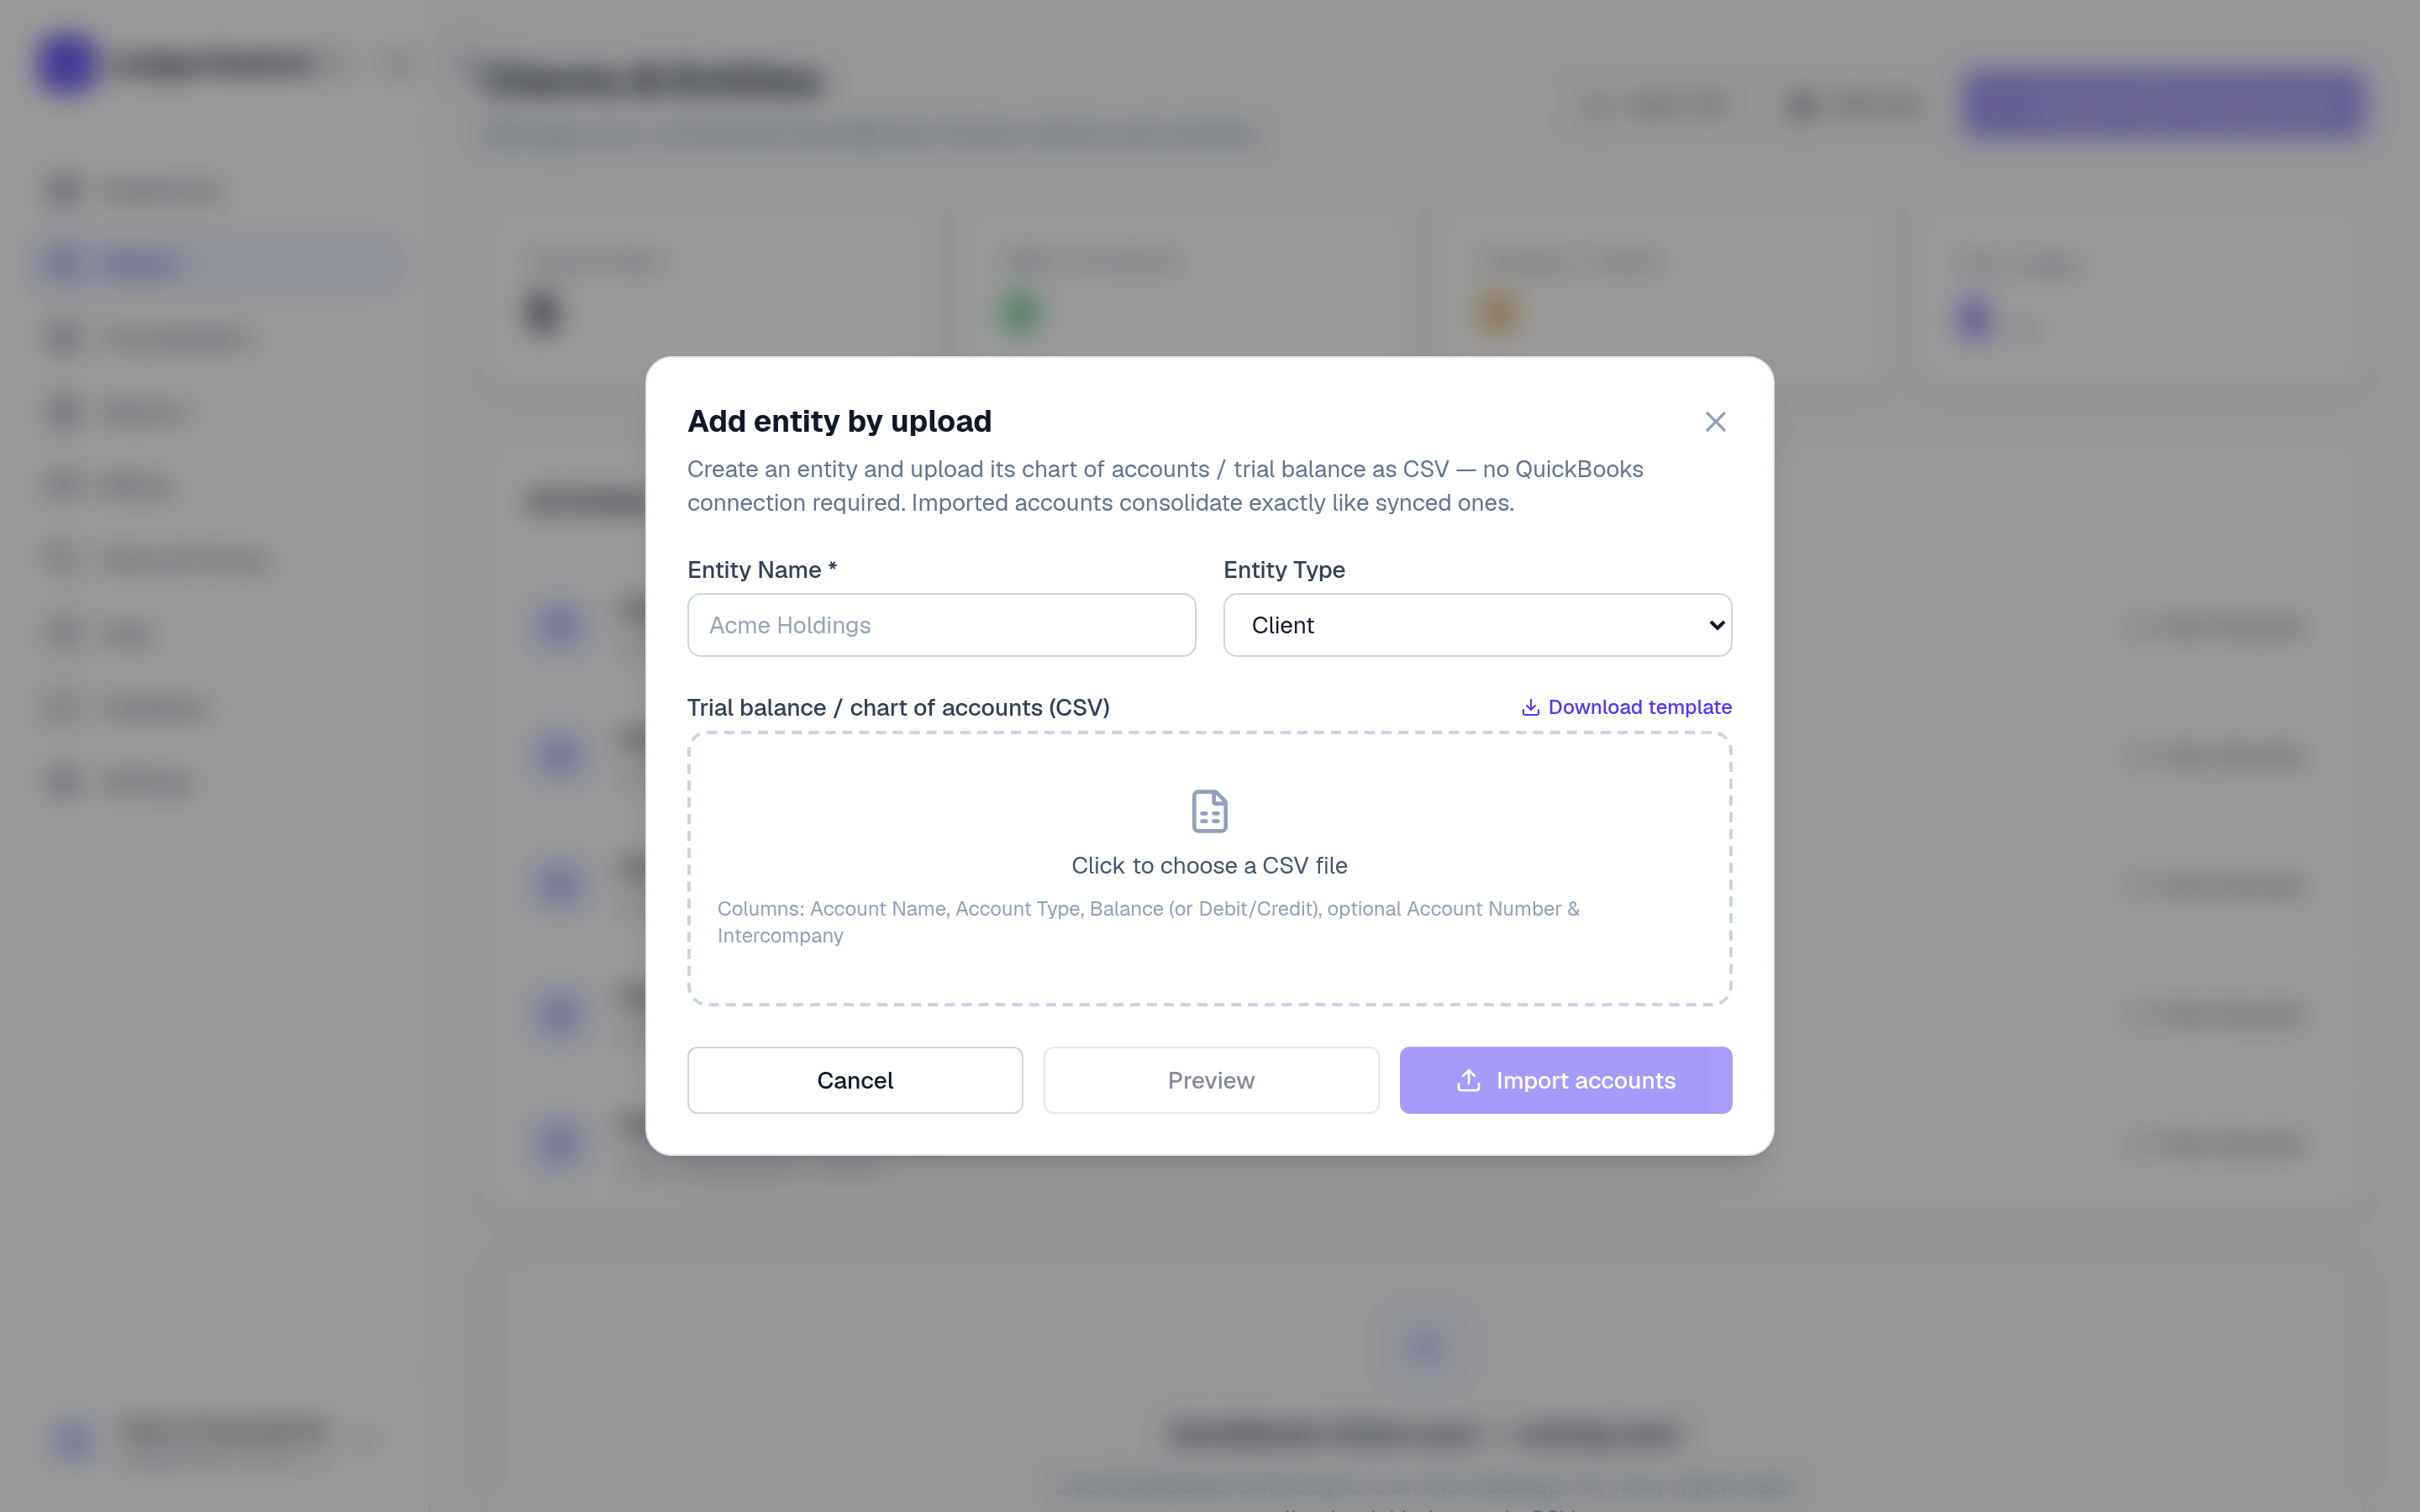
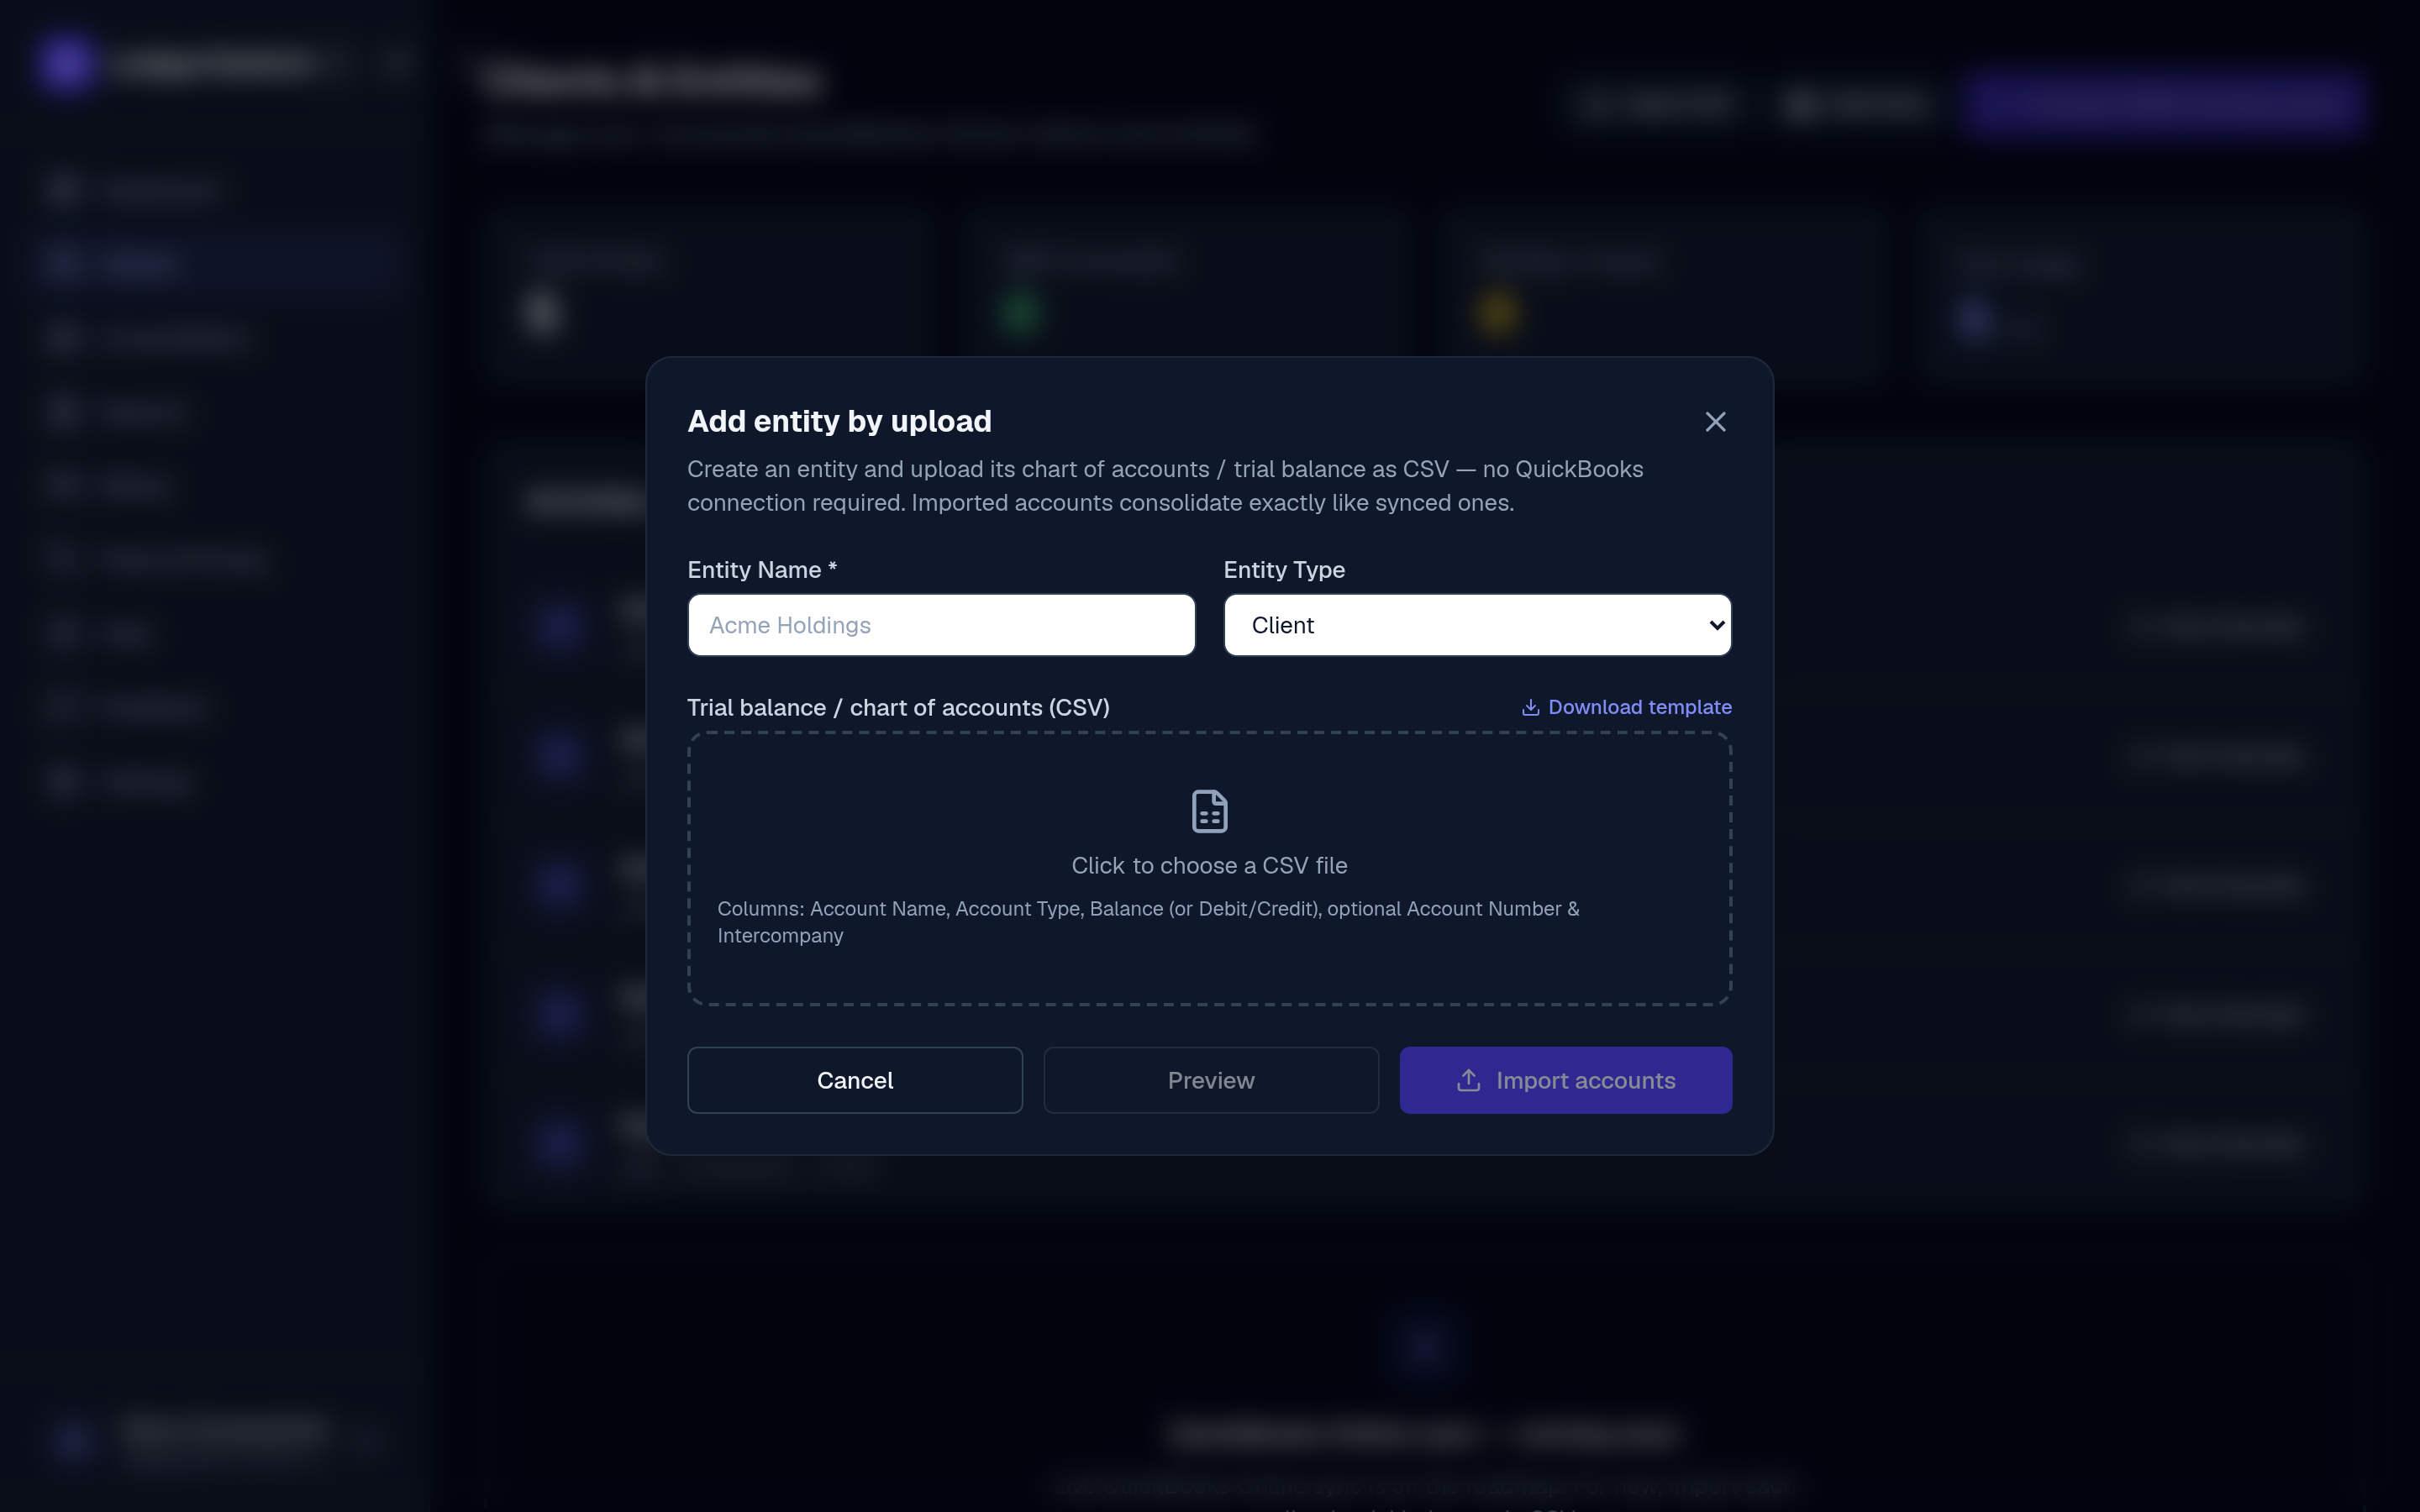
The importer recognizes common column names automatically (Account Name, Account Type, Balance or Debit/Credit, optional Account Number and Intercompany flag). Re-importing the same file updates the same company rather than duplicating it.
Add Entity creates an empty company shell you can import into later. Connect QBO (automatic QuickBooks Online sync) is on the roadmap and shown as "coming soon" — imported CSV books work exactly the same in every report.
How do I read the dashboard?
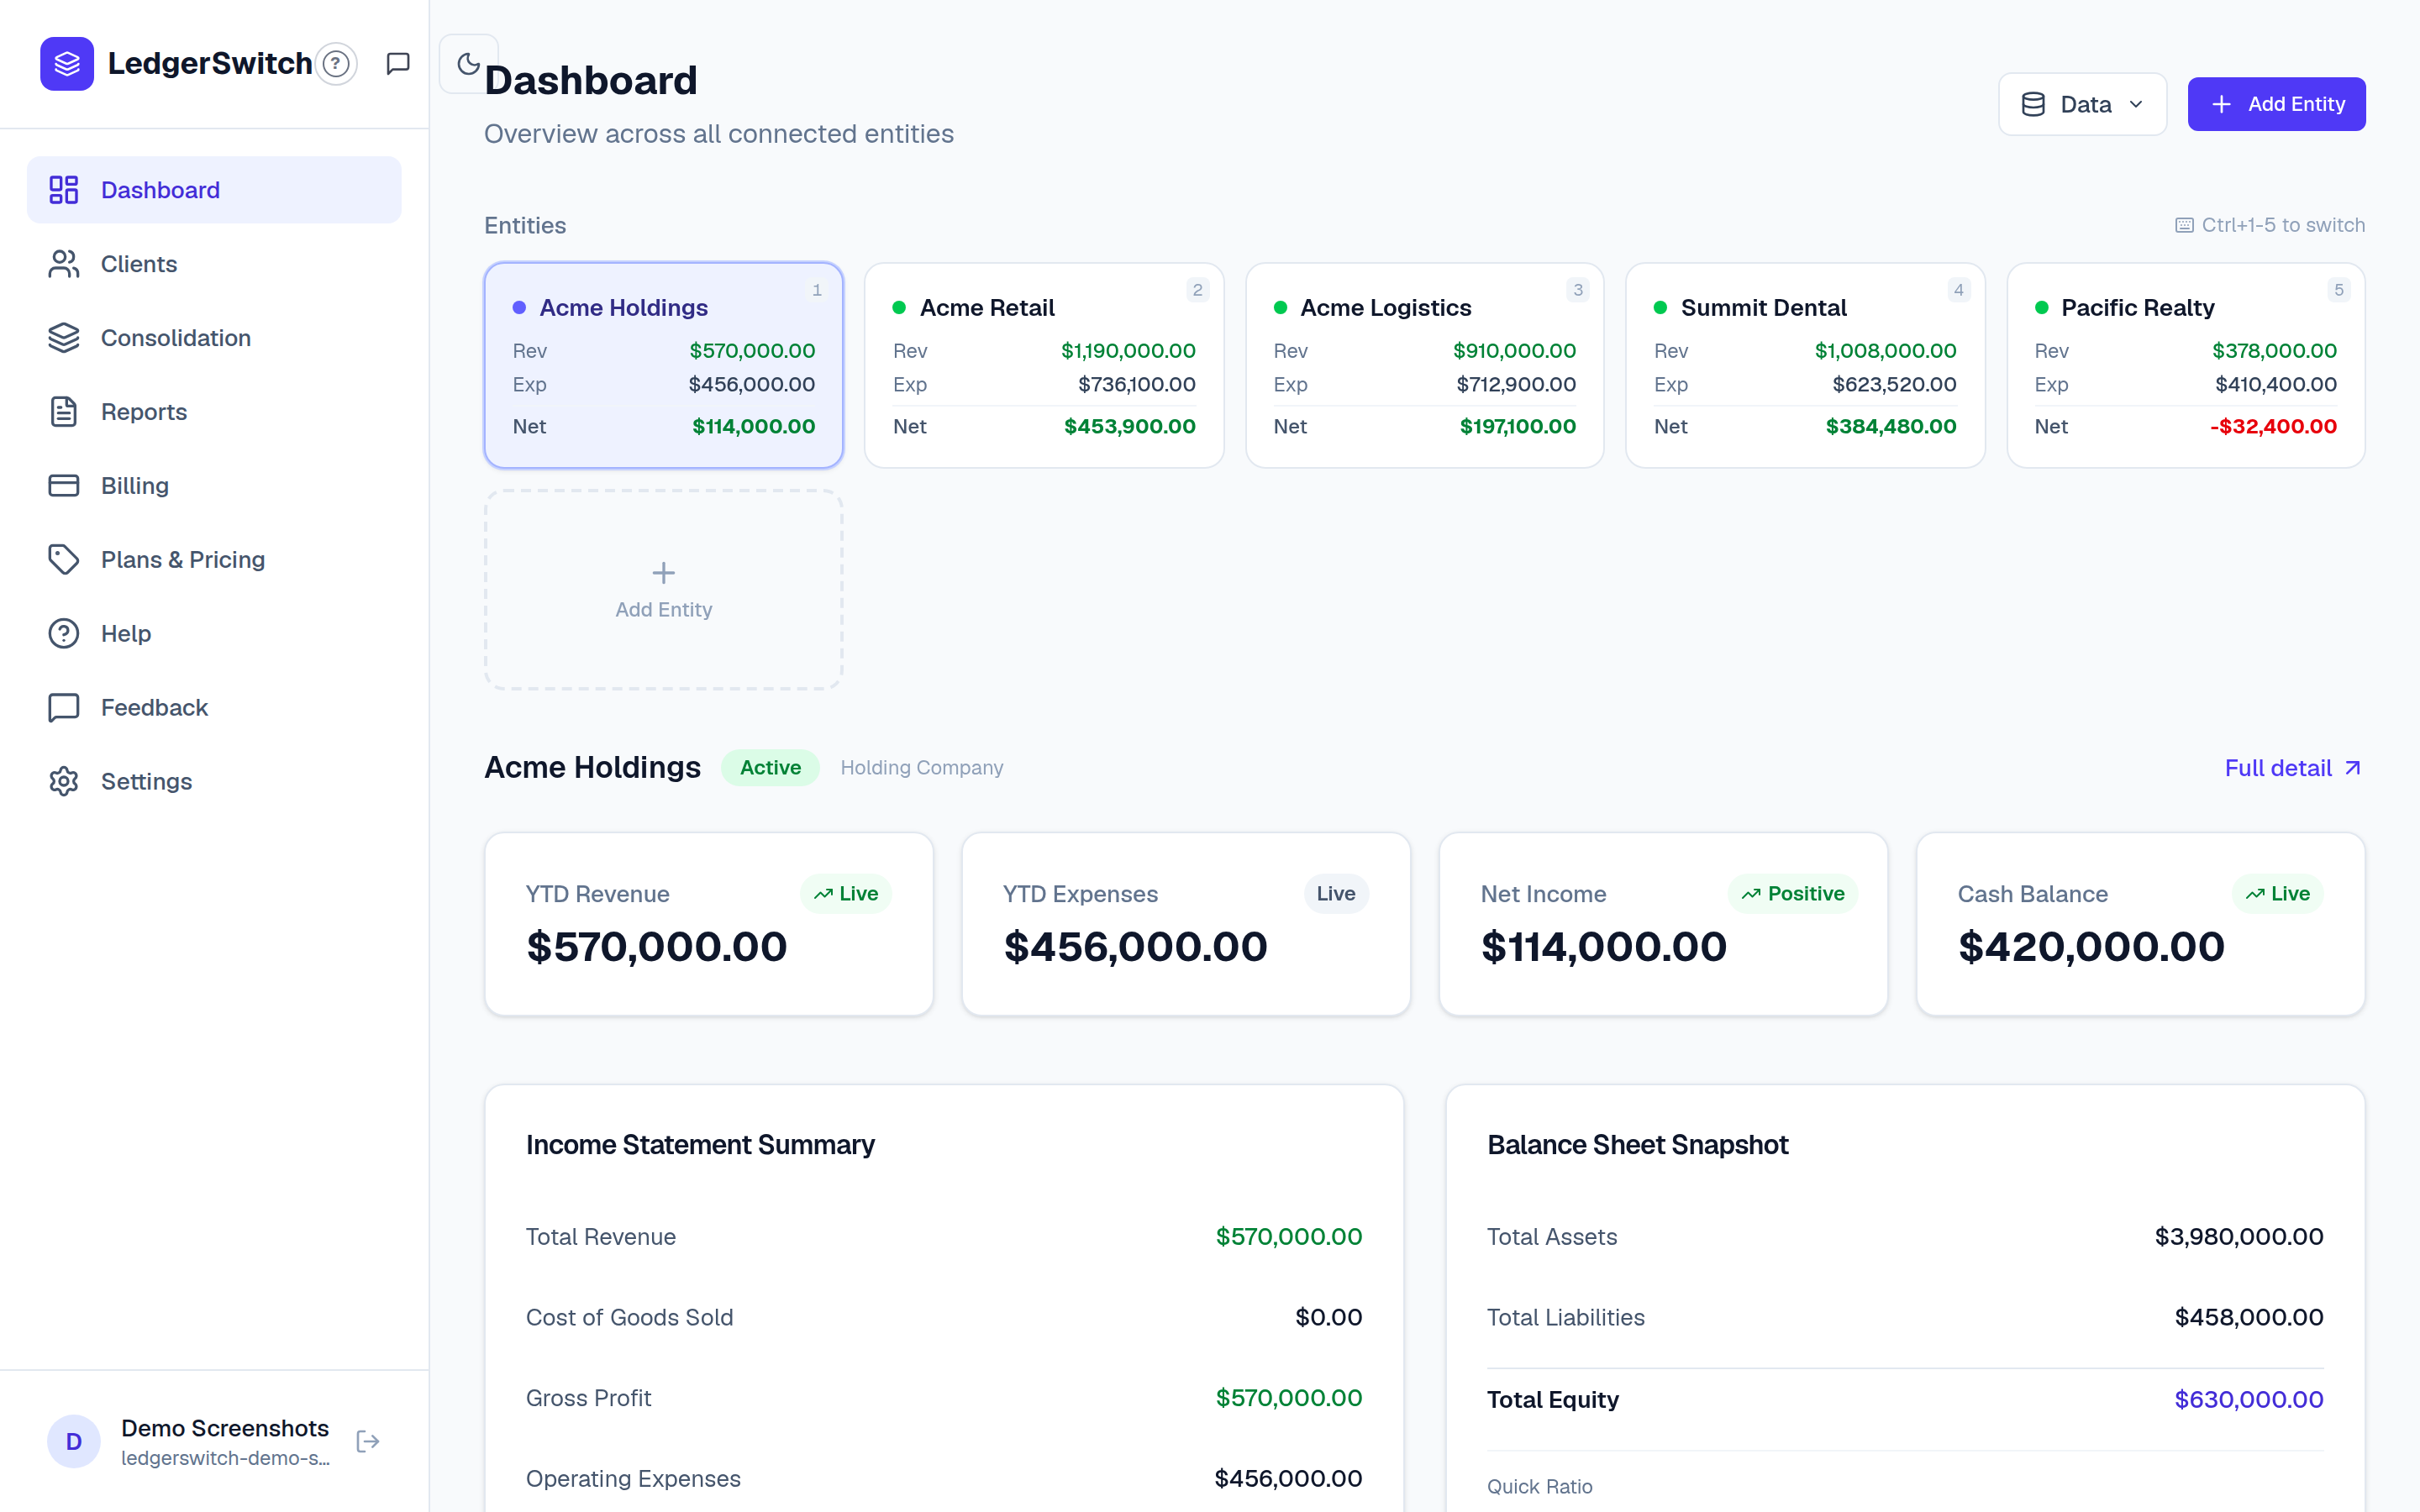
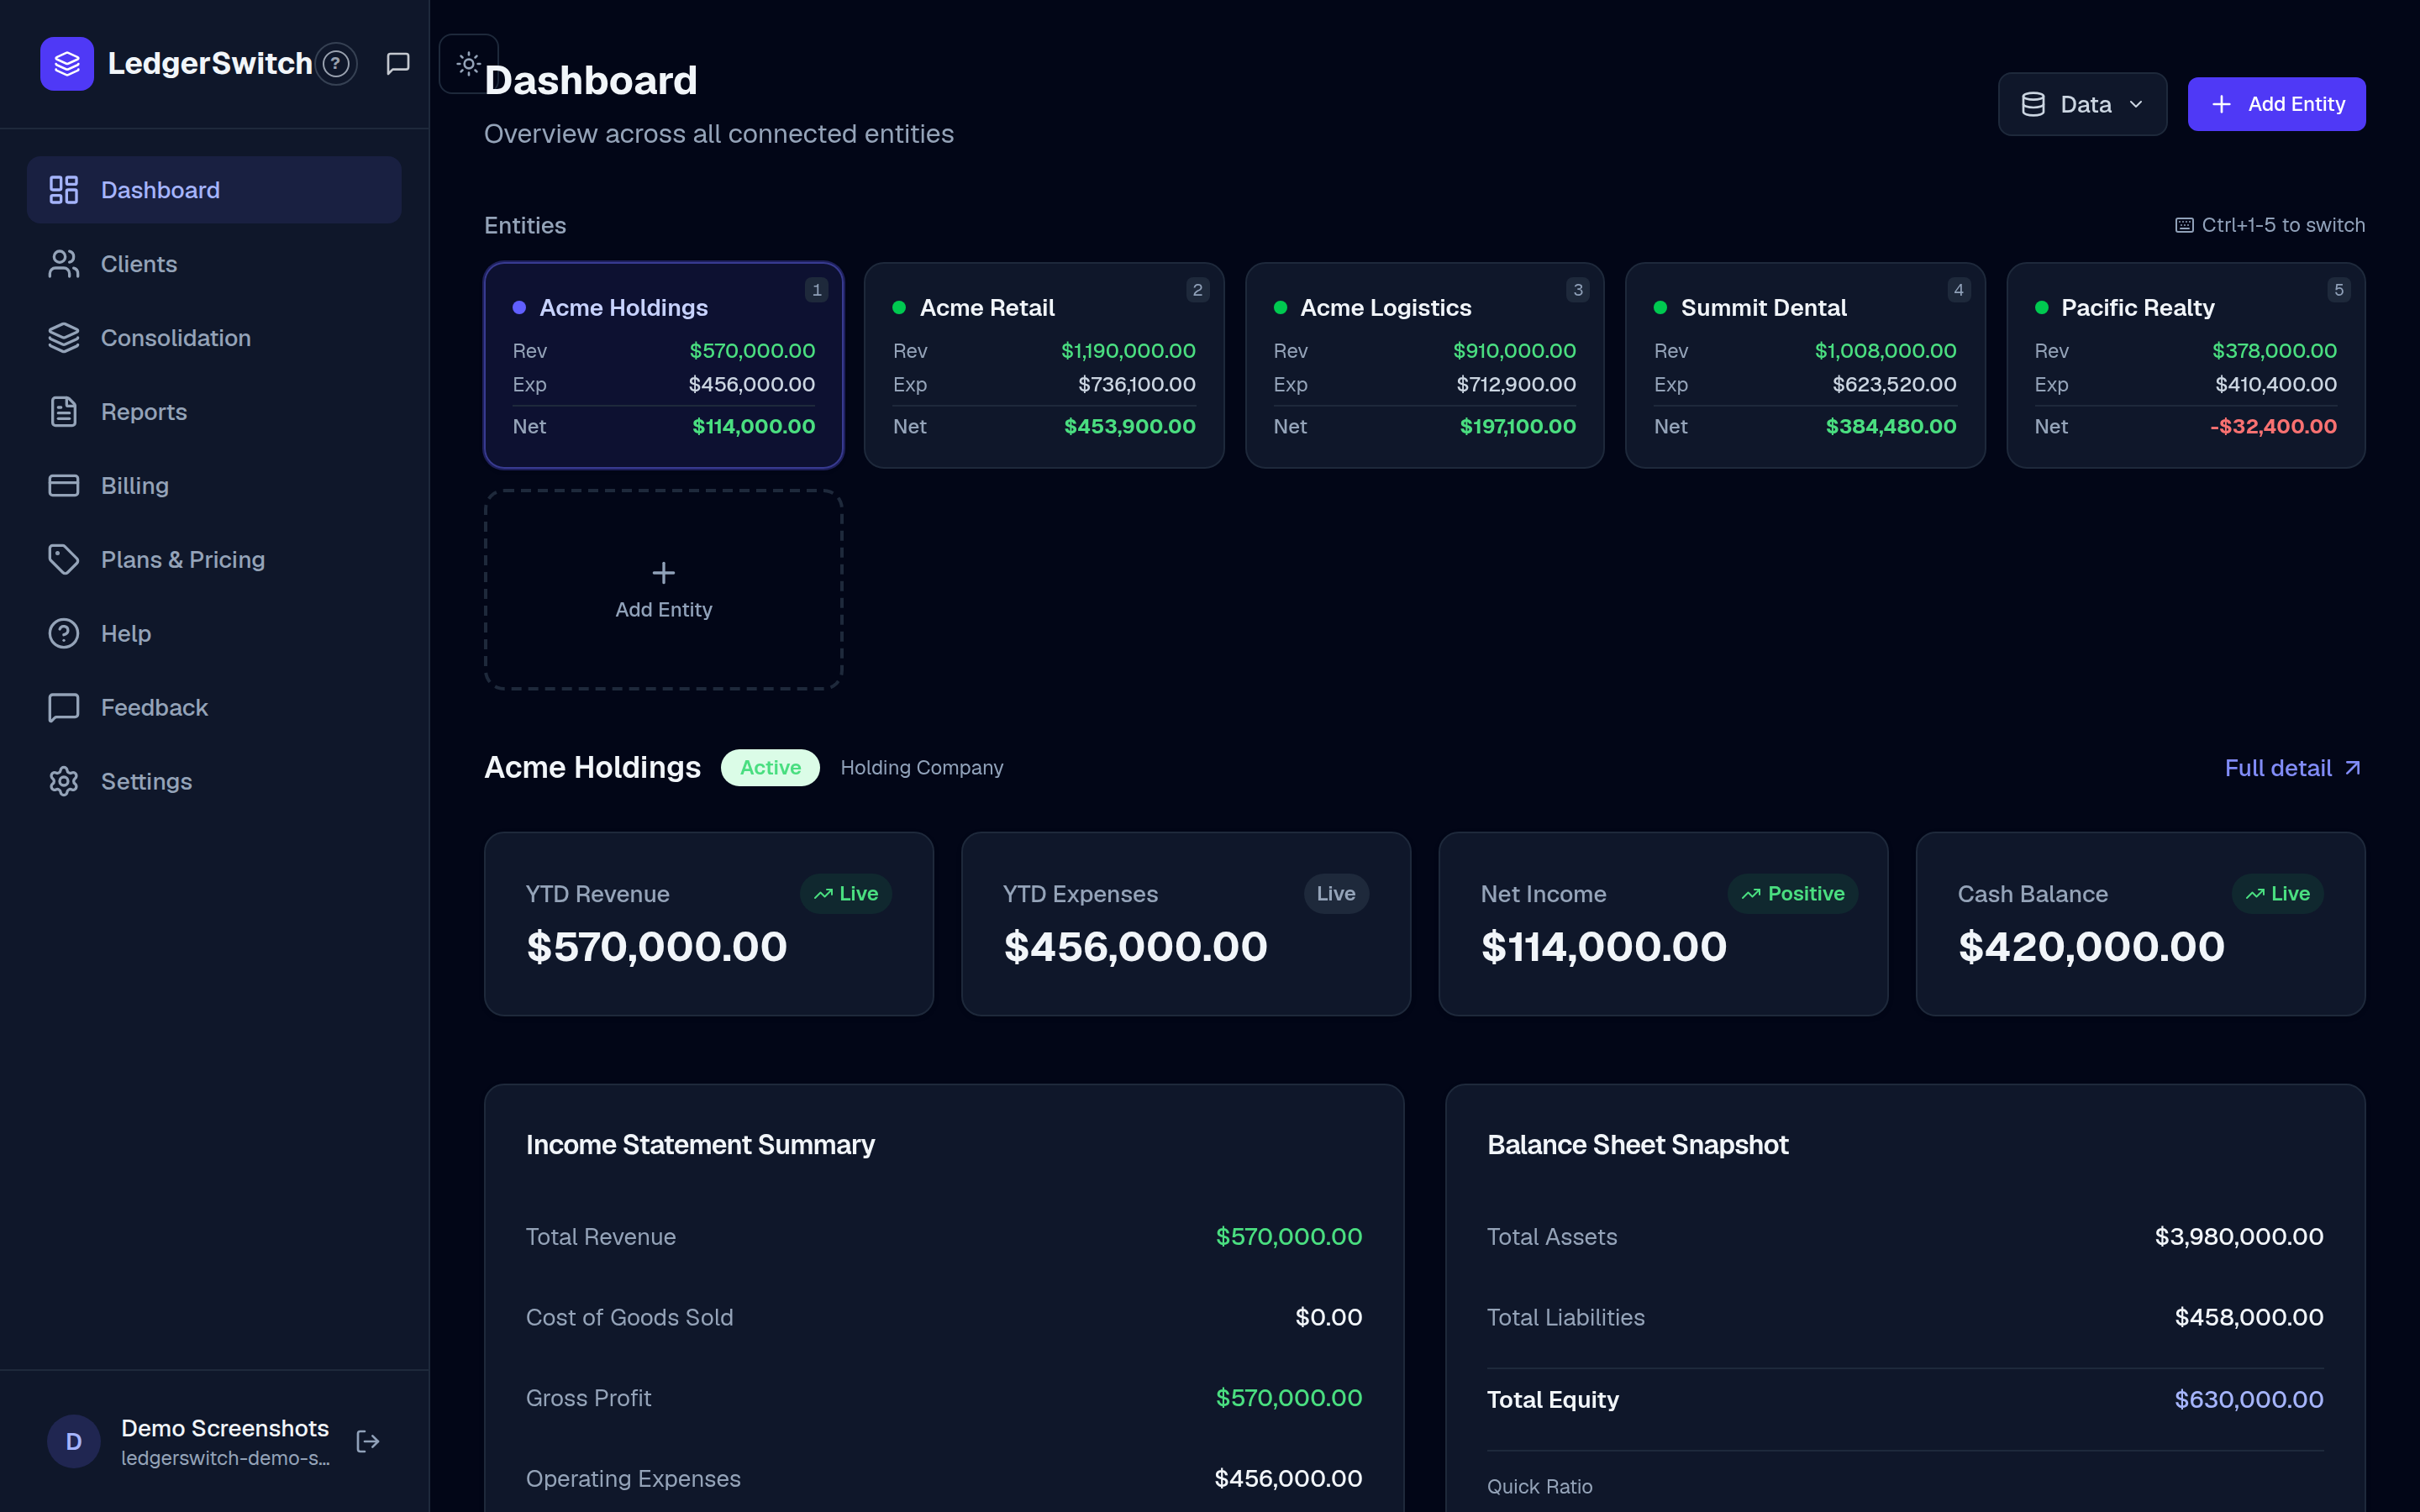
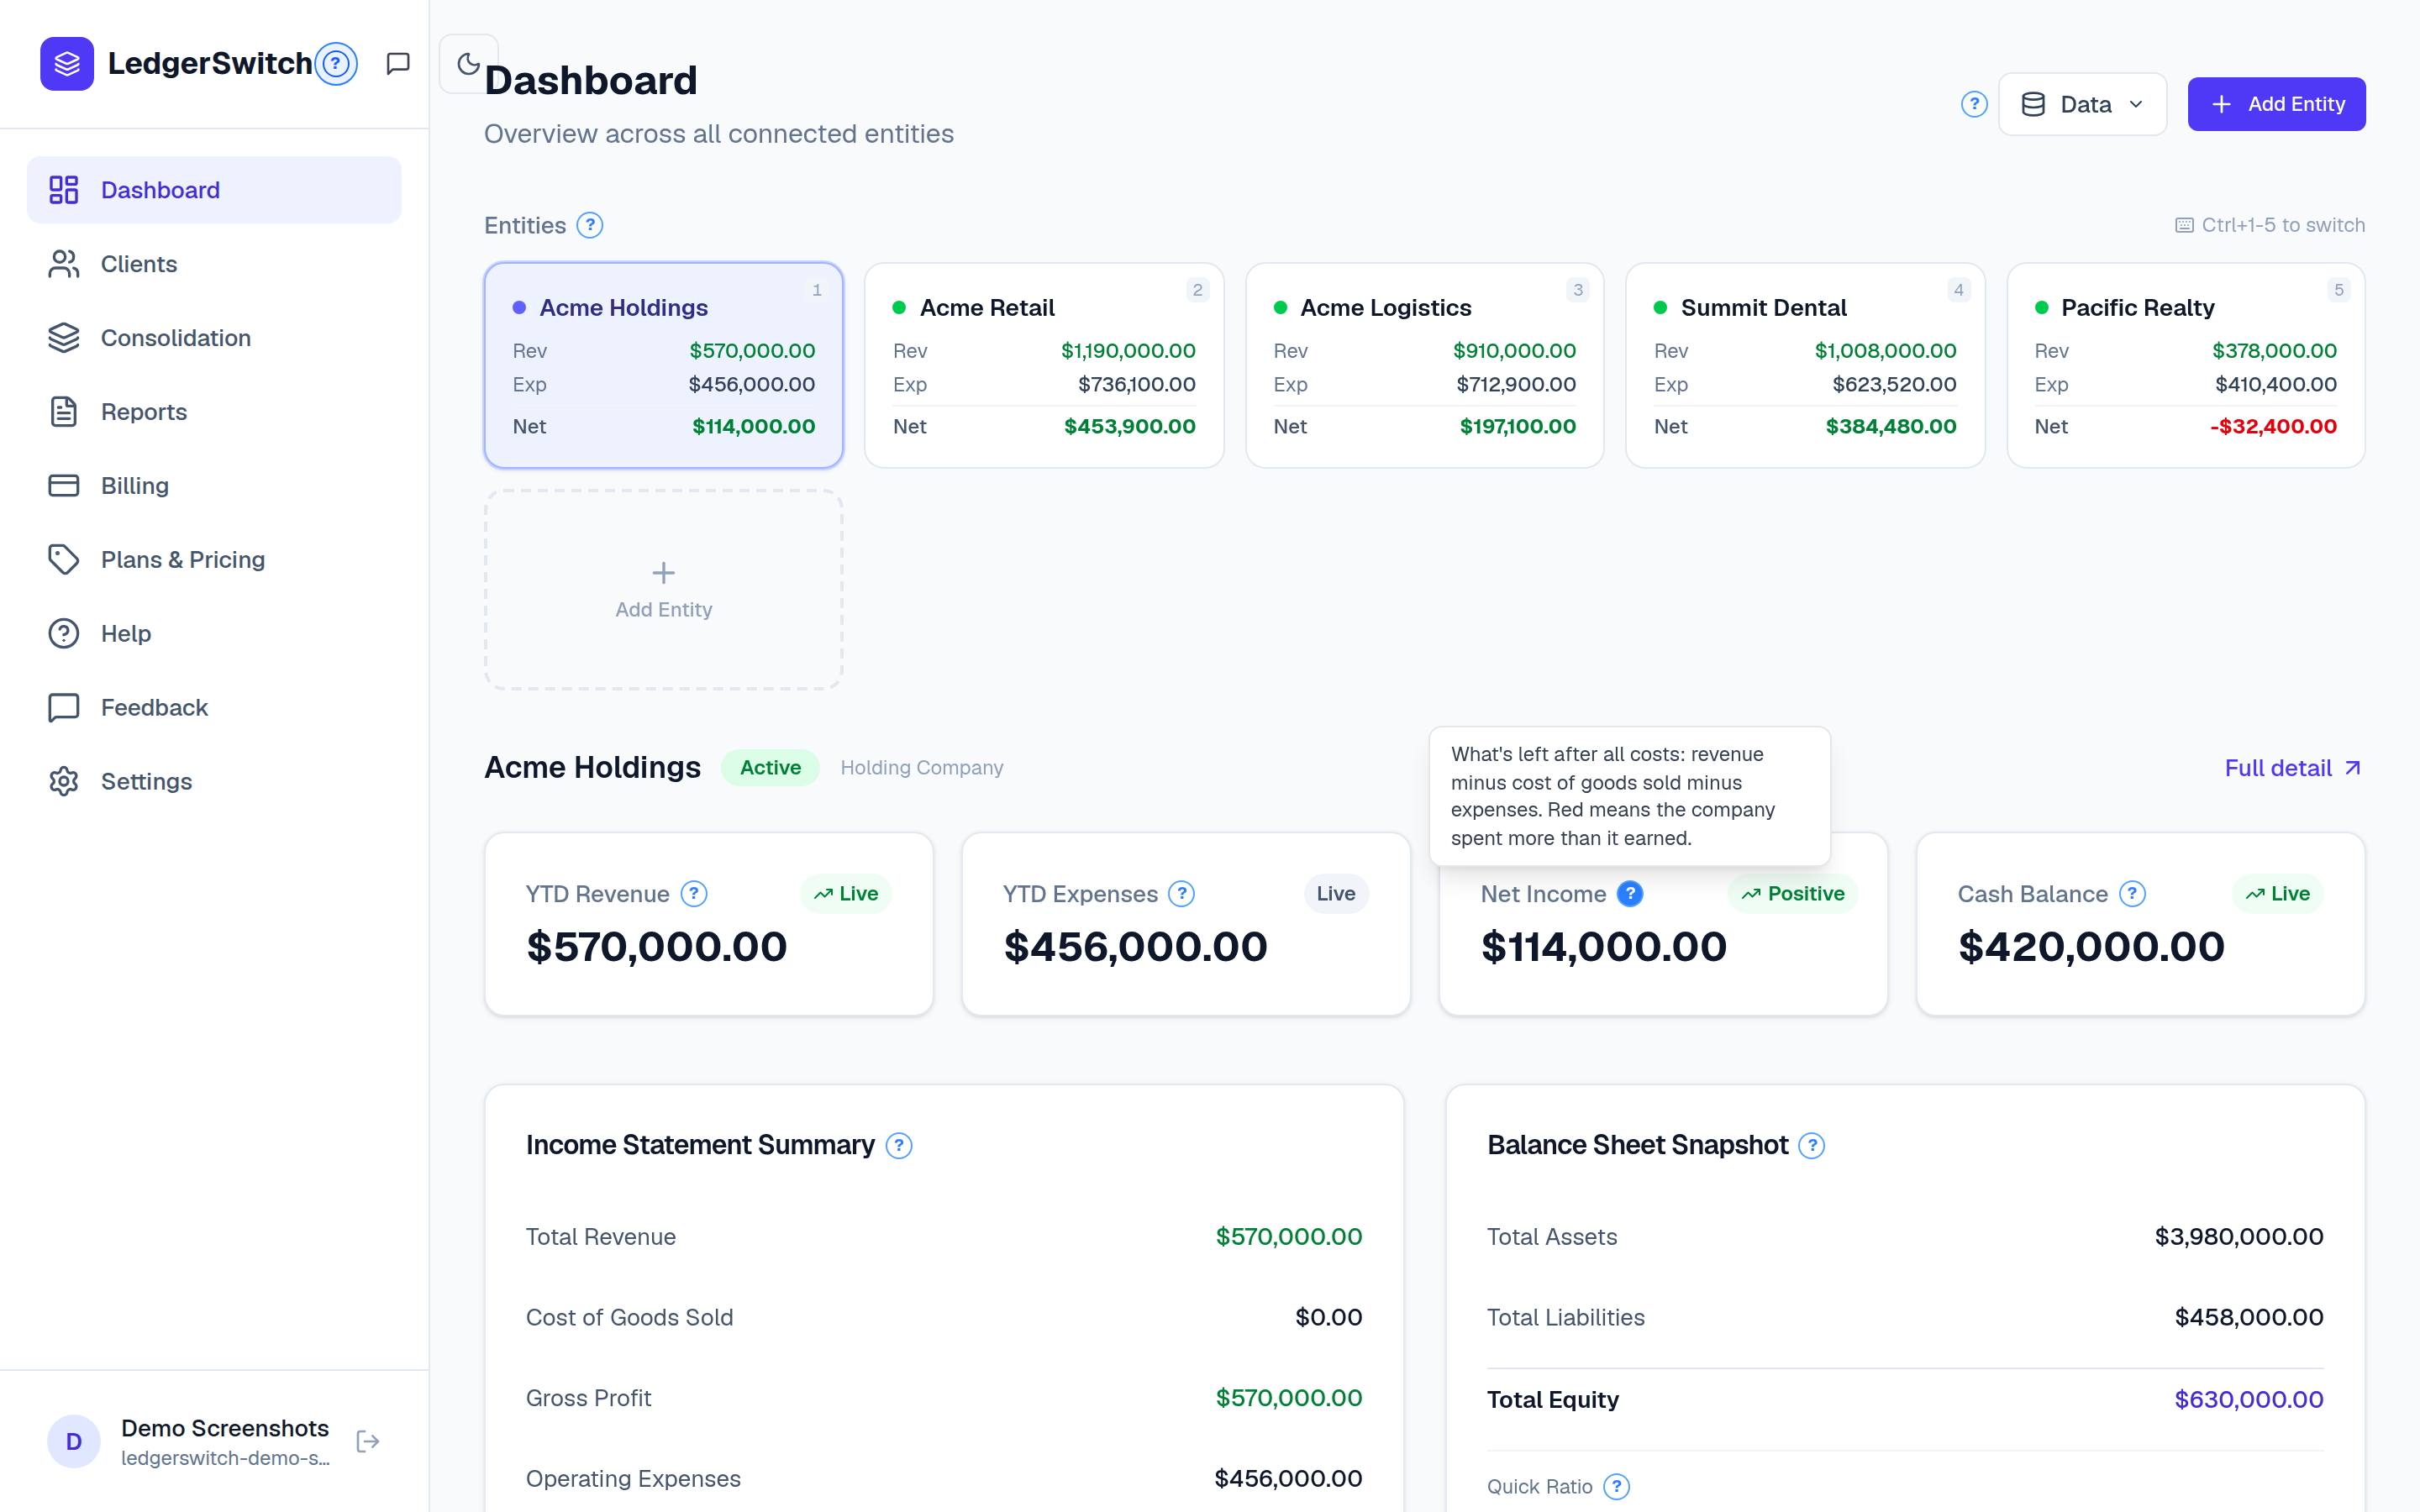
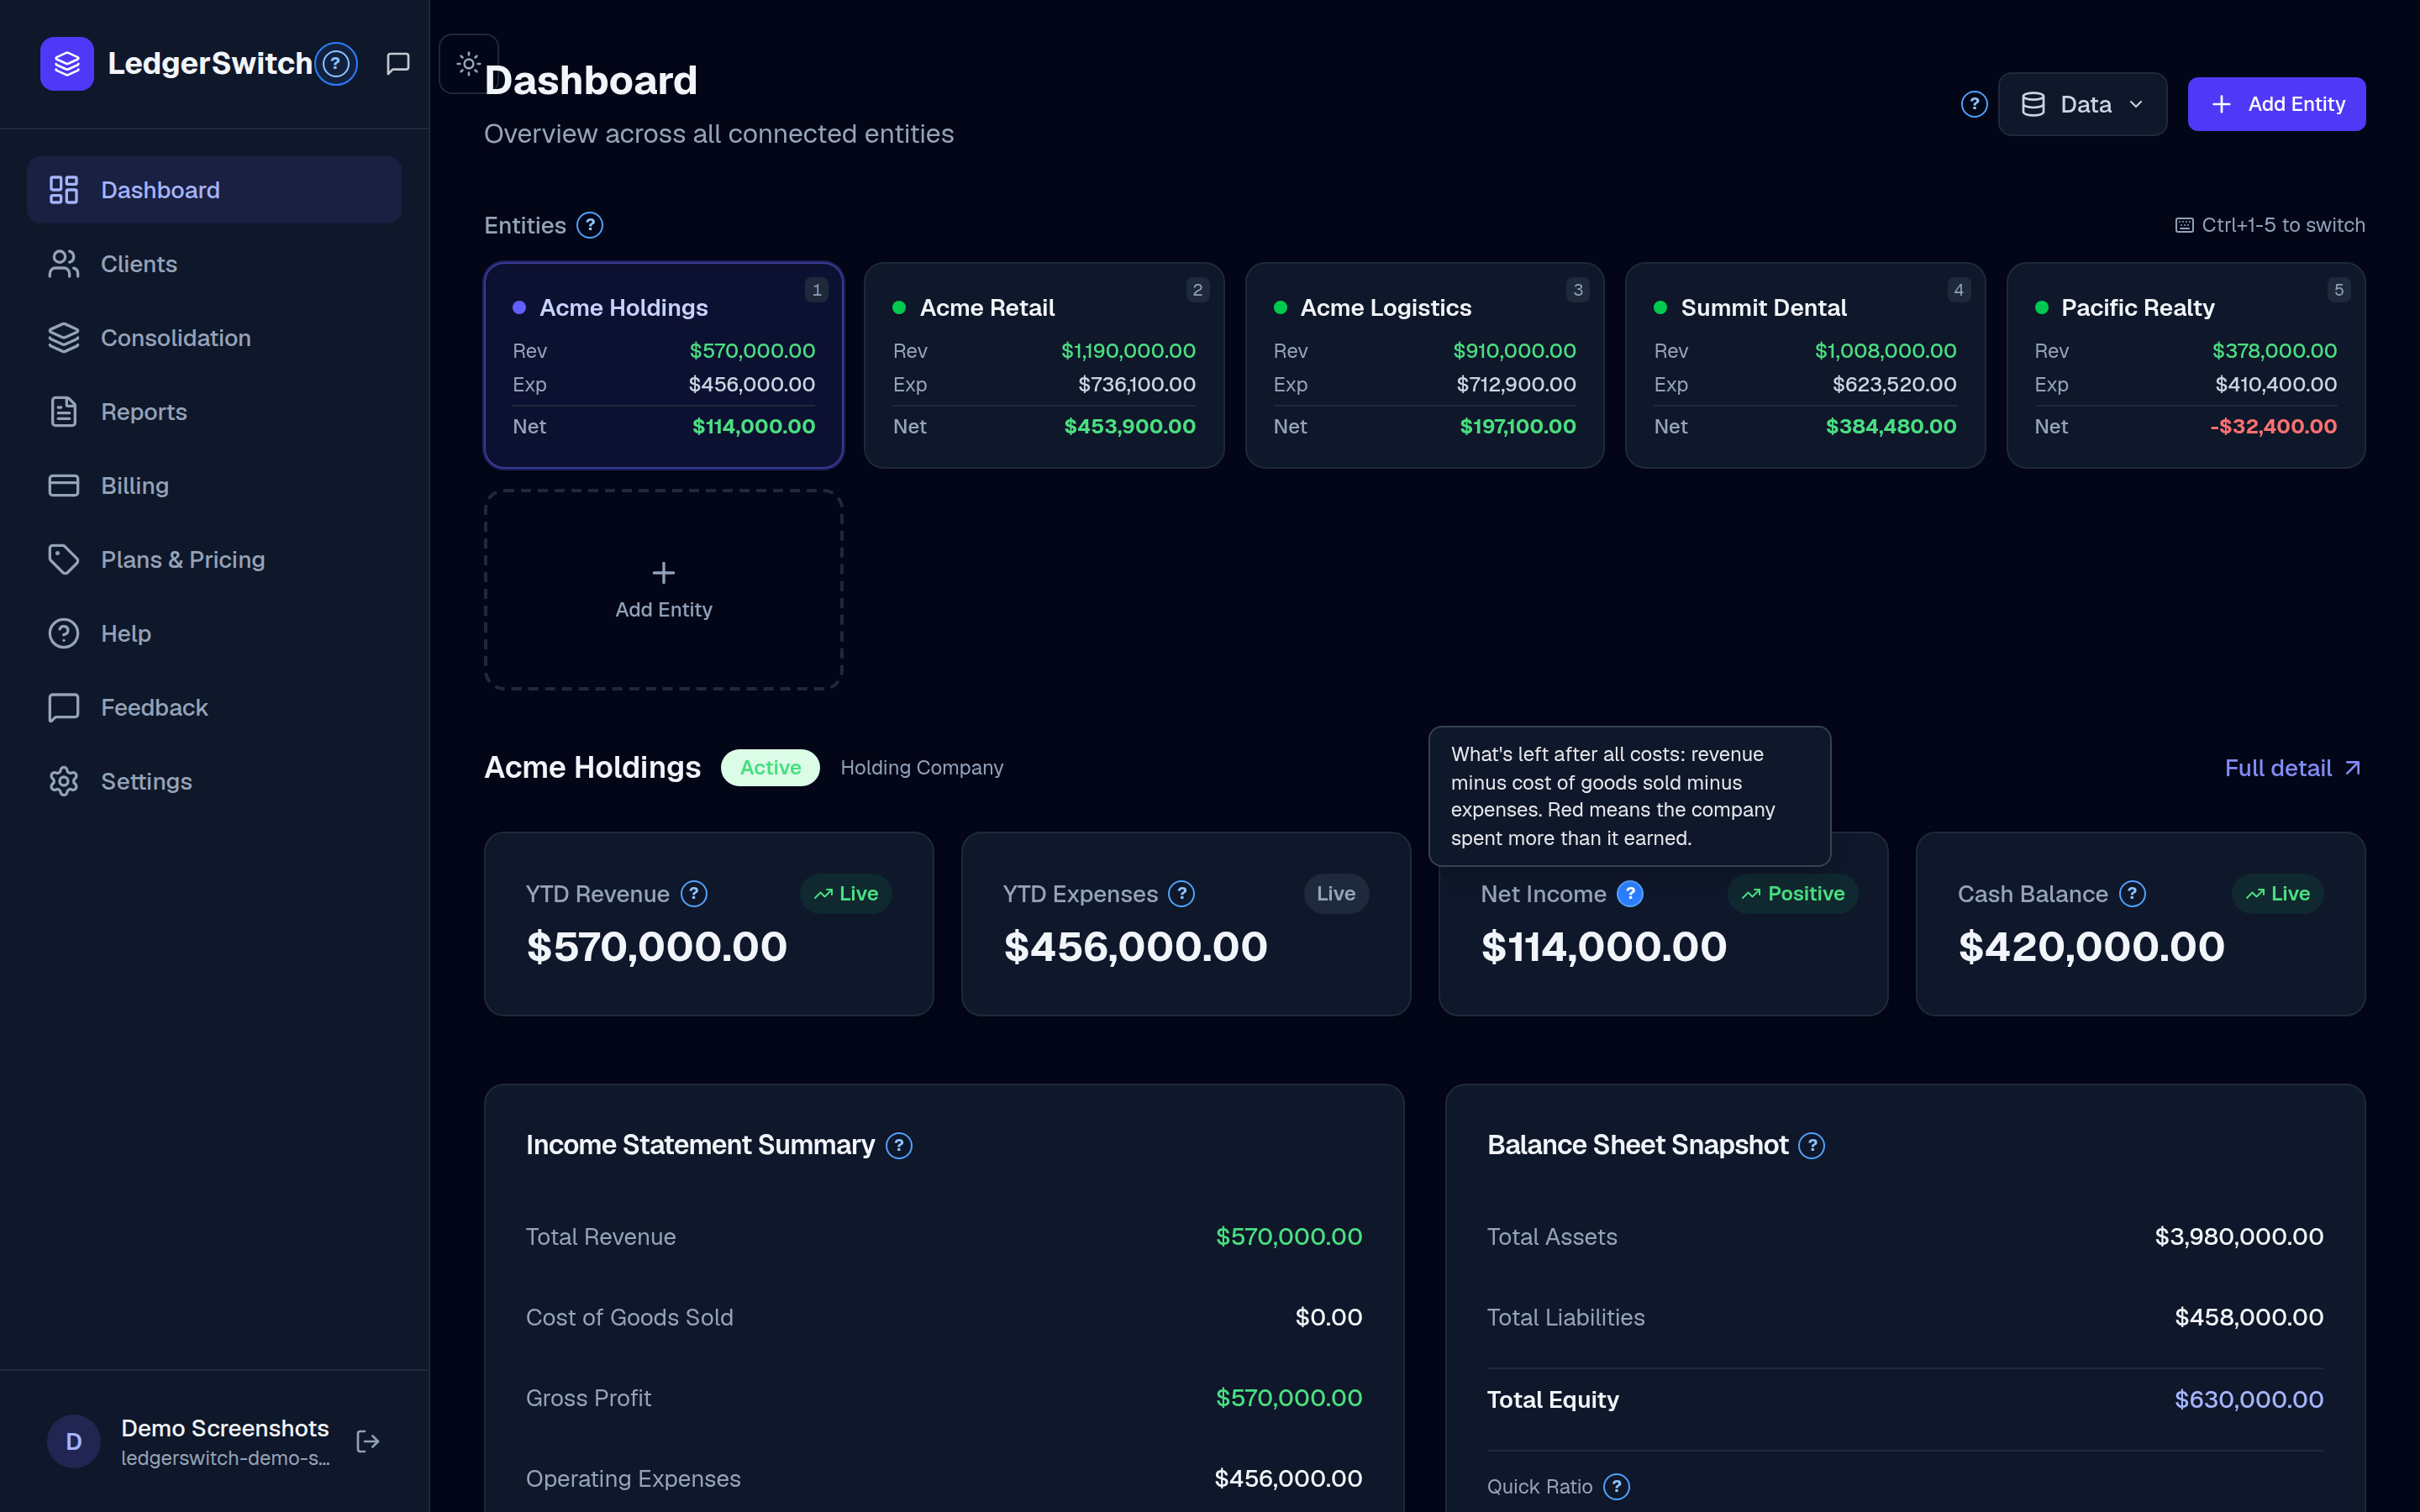
- Entity cards (top) — one card per company with its revenue, expenses, and net income. Click a card to switch, or press Ctrl+1–9.
- Metric cards — the selected company's year-to-date revenue, expenses, net income, and checking-account cash.
- Income Statement Summary / Balance Sheet Snapshot — mini statements for the selected company; "View full P&L" opens the detail page.
- Charts — revenue vs expenses, expense breakdown, net income, and cash position across companies.
- Consolidated Totals (bottom bar) — all companies added together, with a link to the full Consolidation report.
Tip: turn on the ? button in the sidebar header (see the in-app help) and hover any "?" marker for a plain-language explanation of that number or button.
How do I see one company's full financials?
Click Full detail on the Dashboard (or View financials on the Clients page). Three tabs show the same books three ways:
- Profit & Loss — what was earned and spent, ending in net income.
- Balance Sheet — what the company owns and owes, and the owners' equity.
- Trial Balance — every account with its debit or credit, for your accountant.
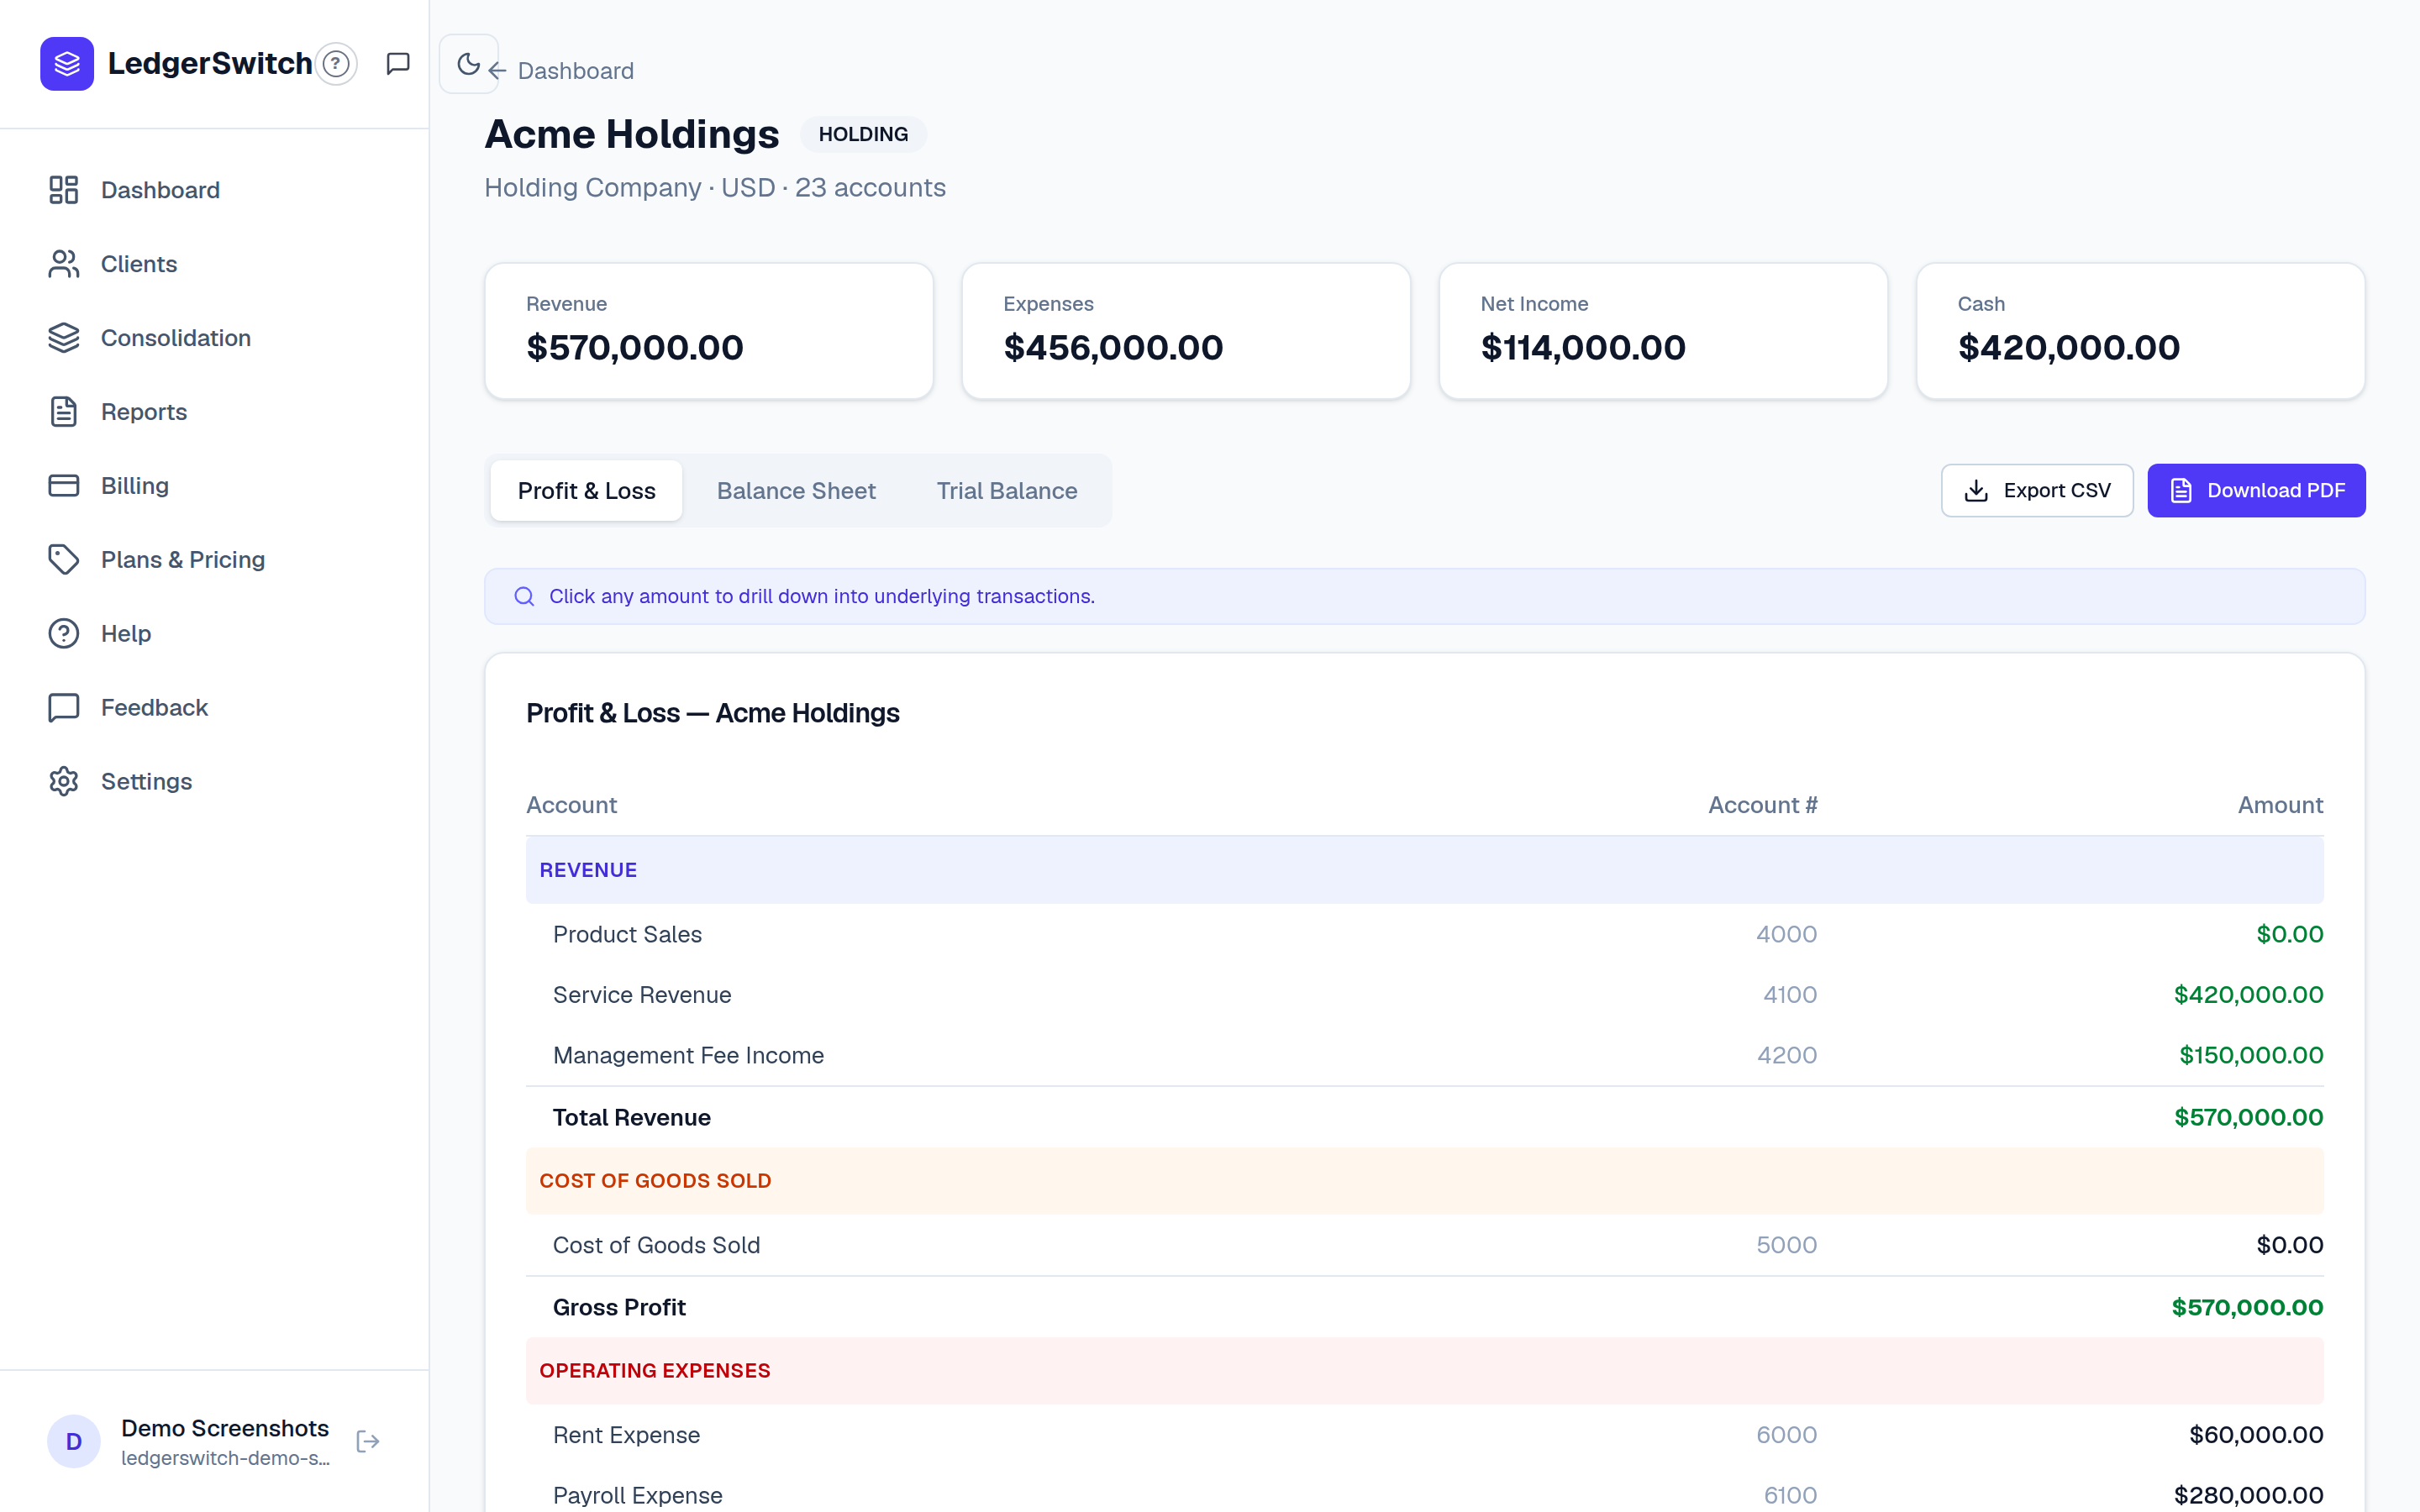
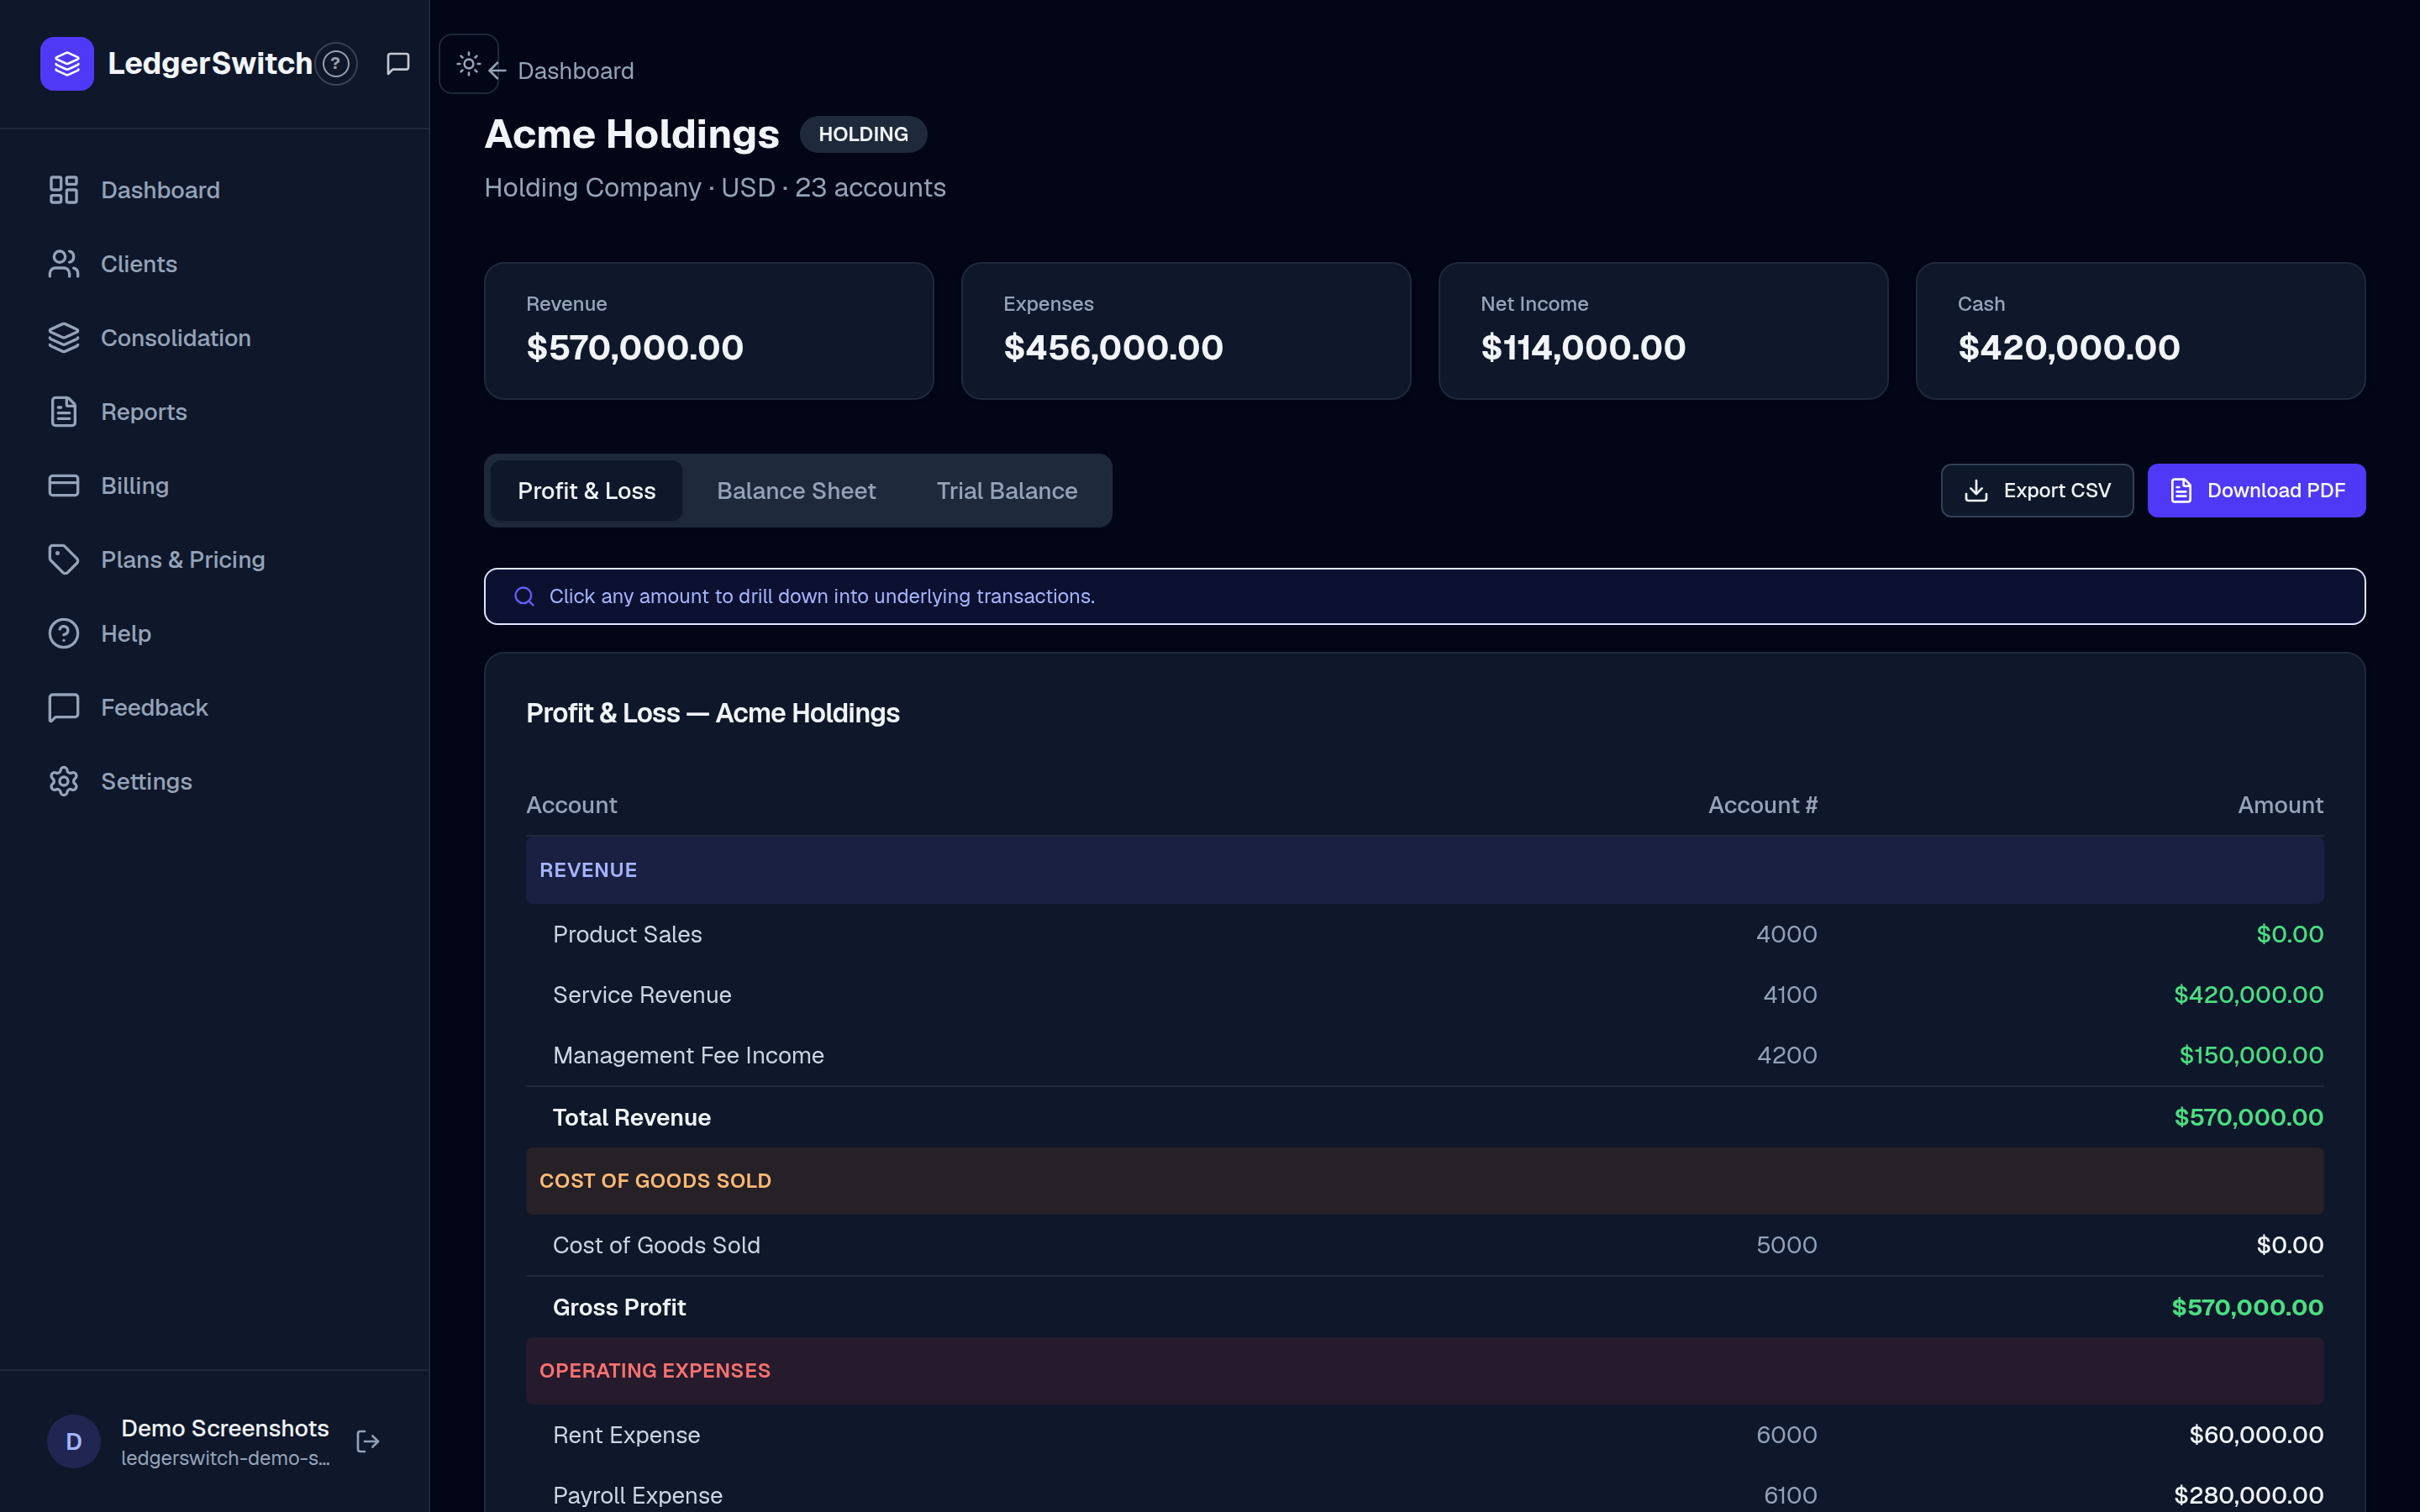
Click any dollar amount to drill down into the transactions behind it. Export the tab you're viewing with Export CSV or Download PDF.
How do I combine several companies into one report?
Open Consolidation. Tick the companies you want on the left — the combined P&L and Balance Sheet rebuild automatically as you change the selection.
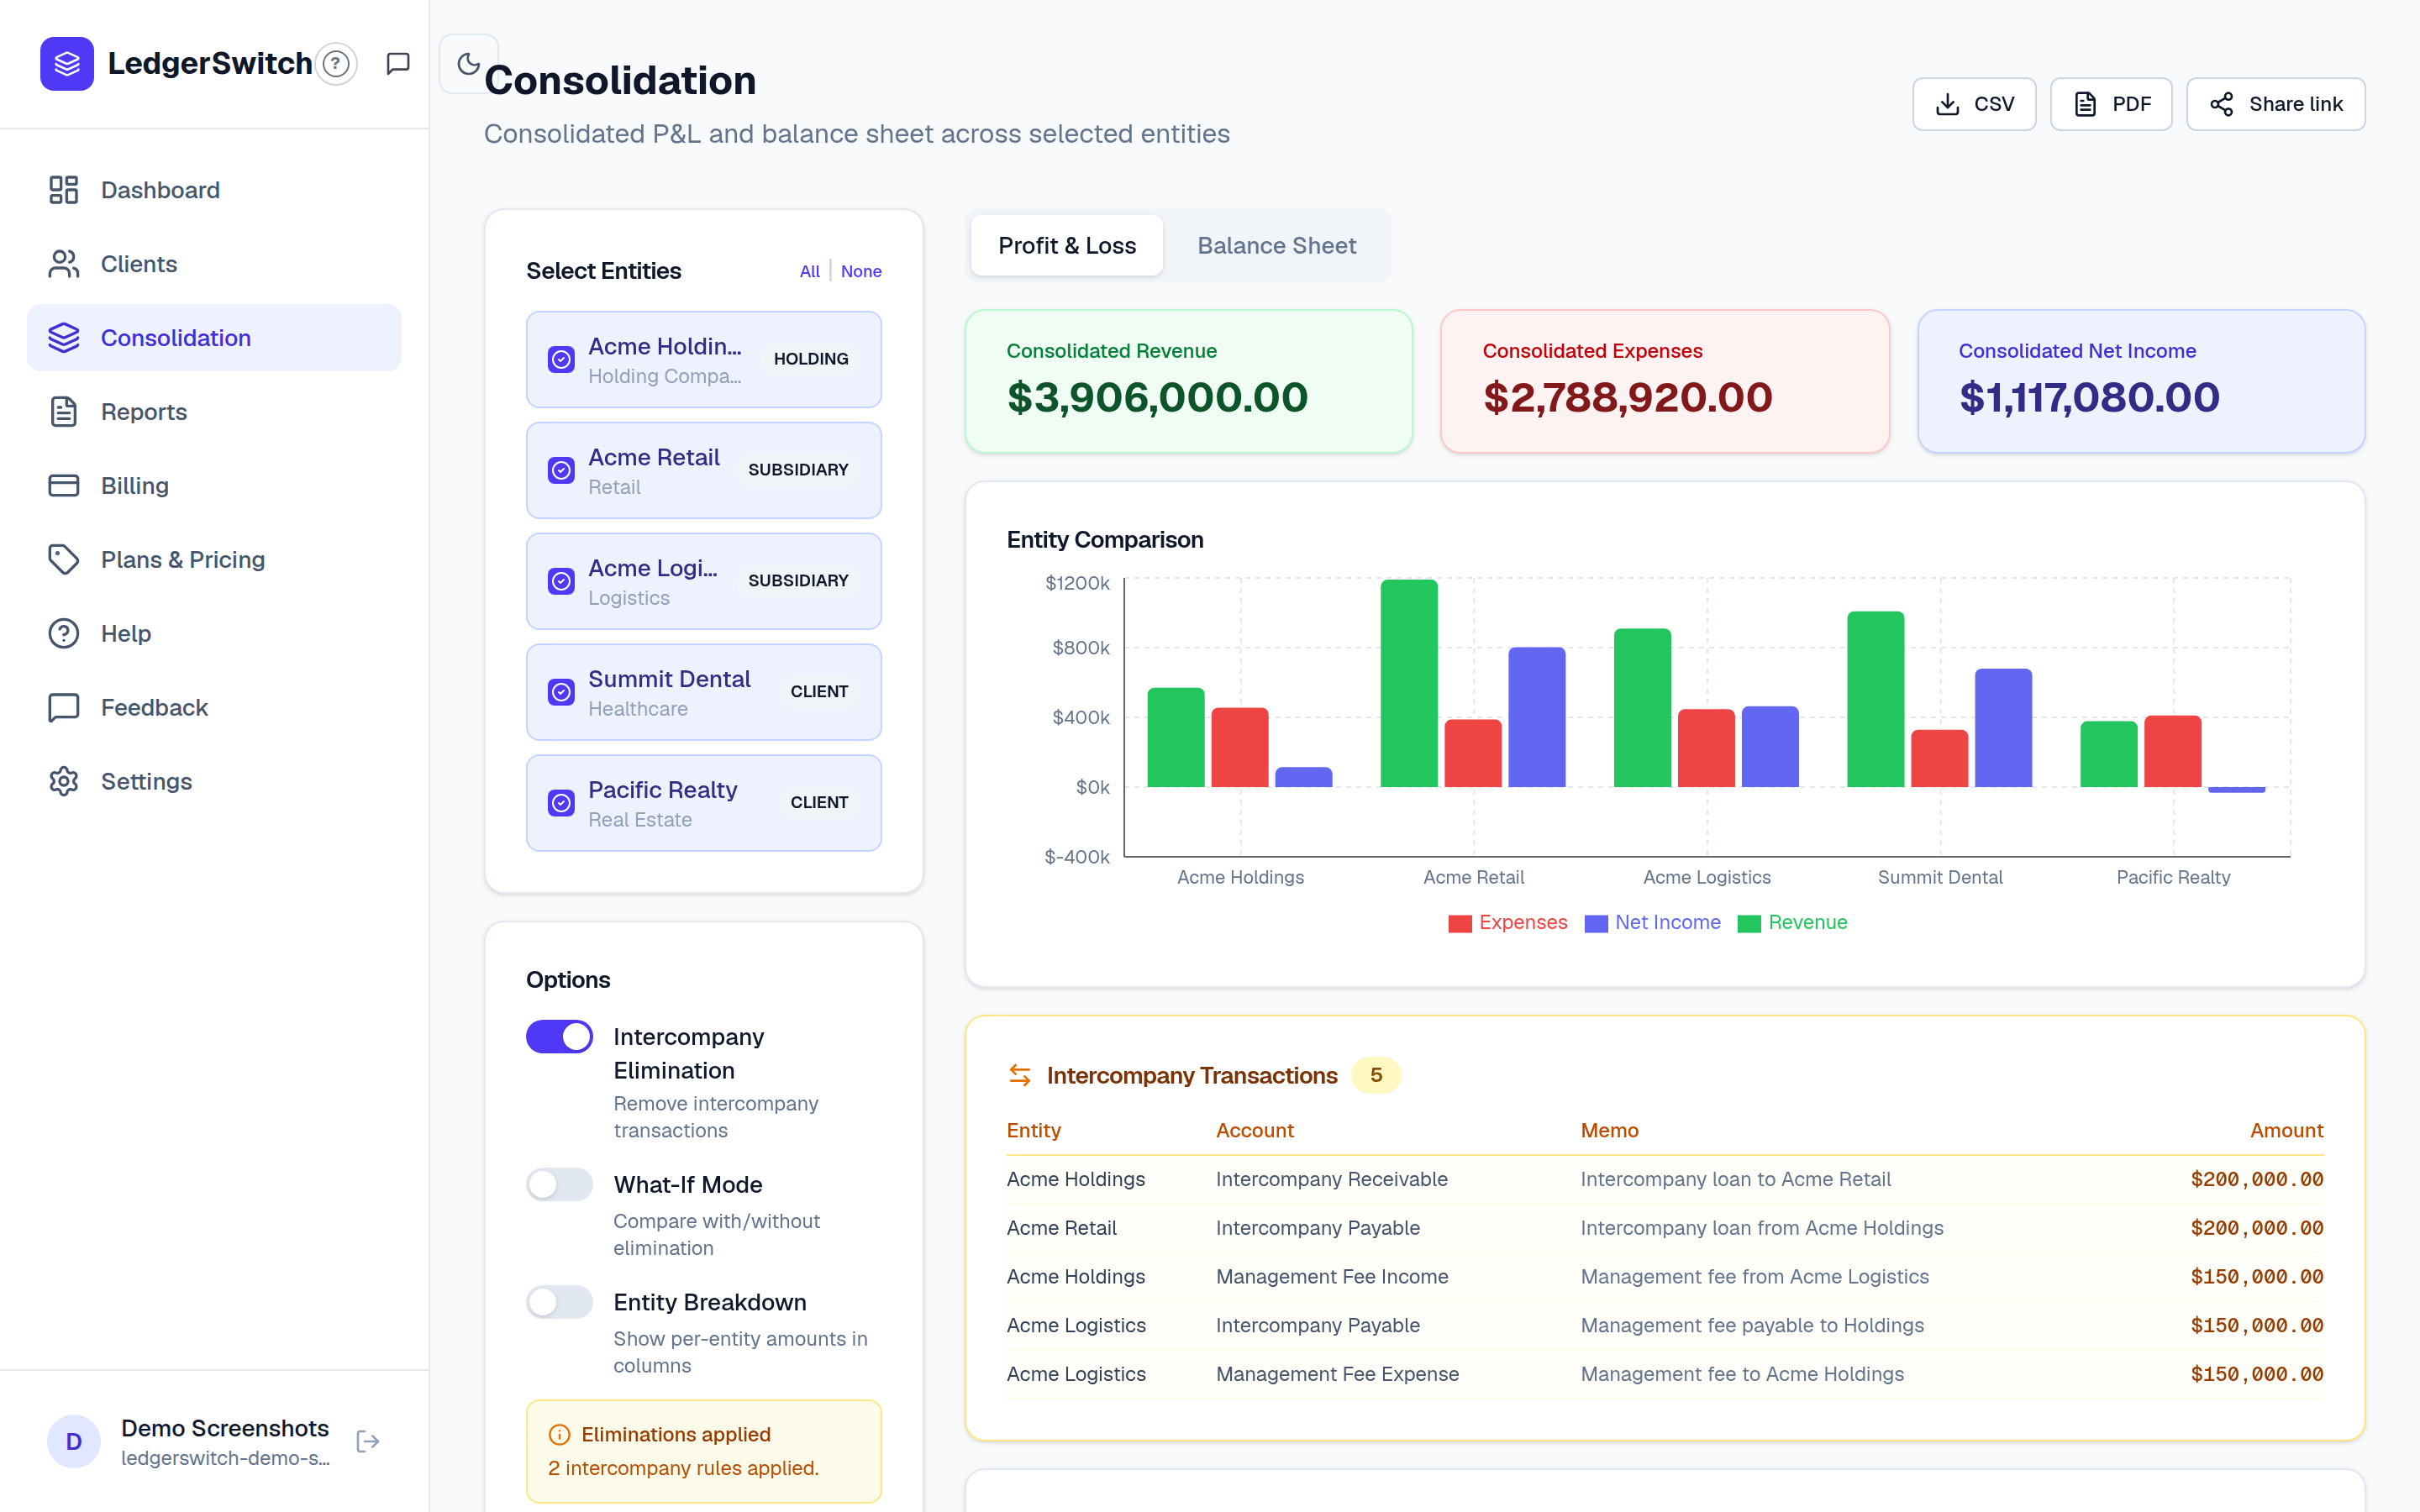
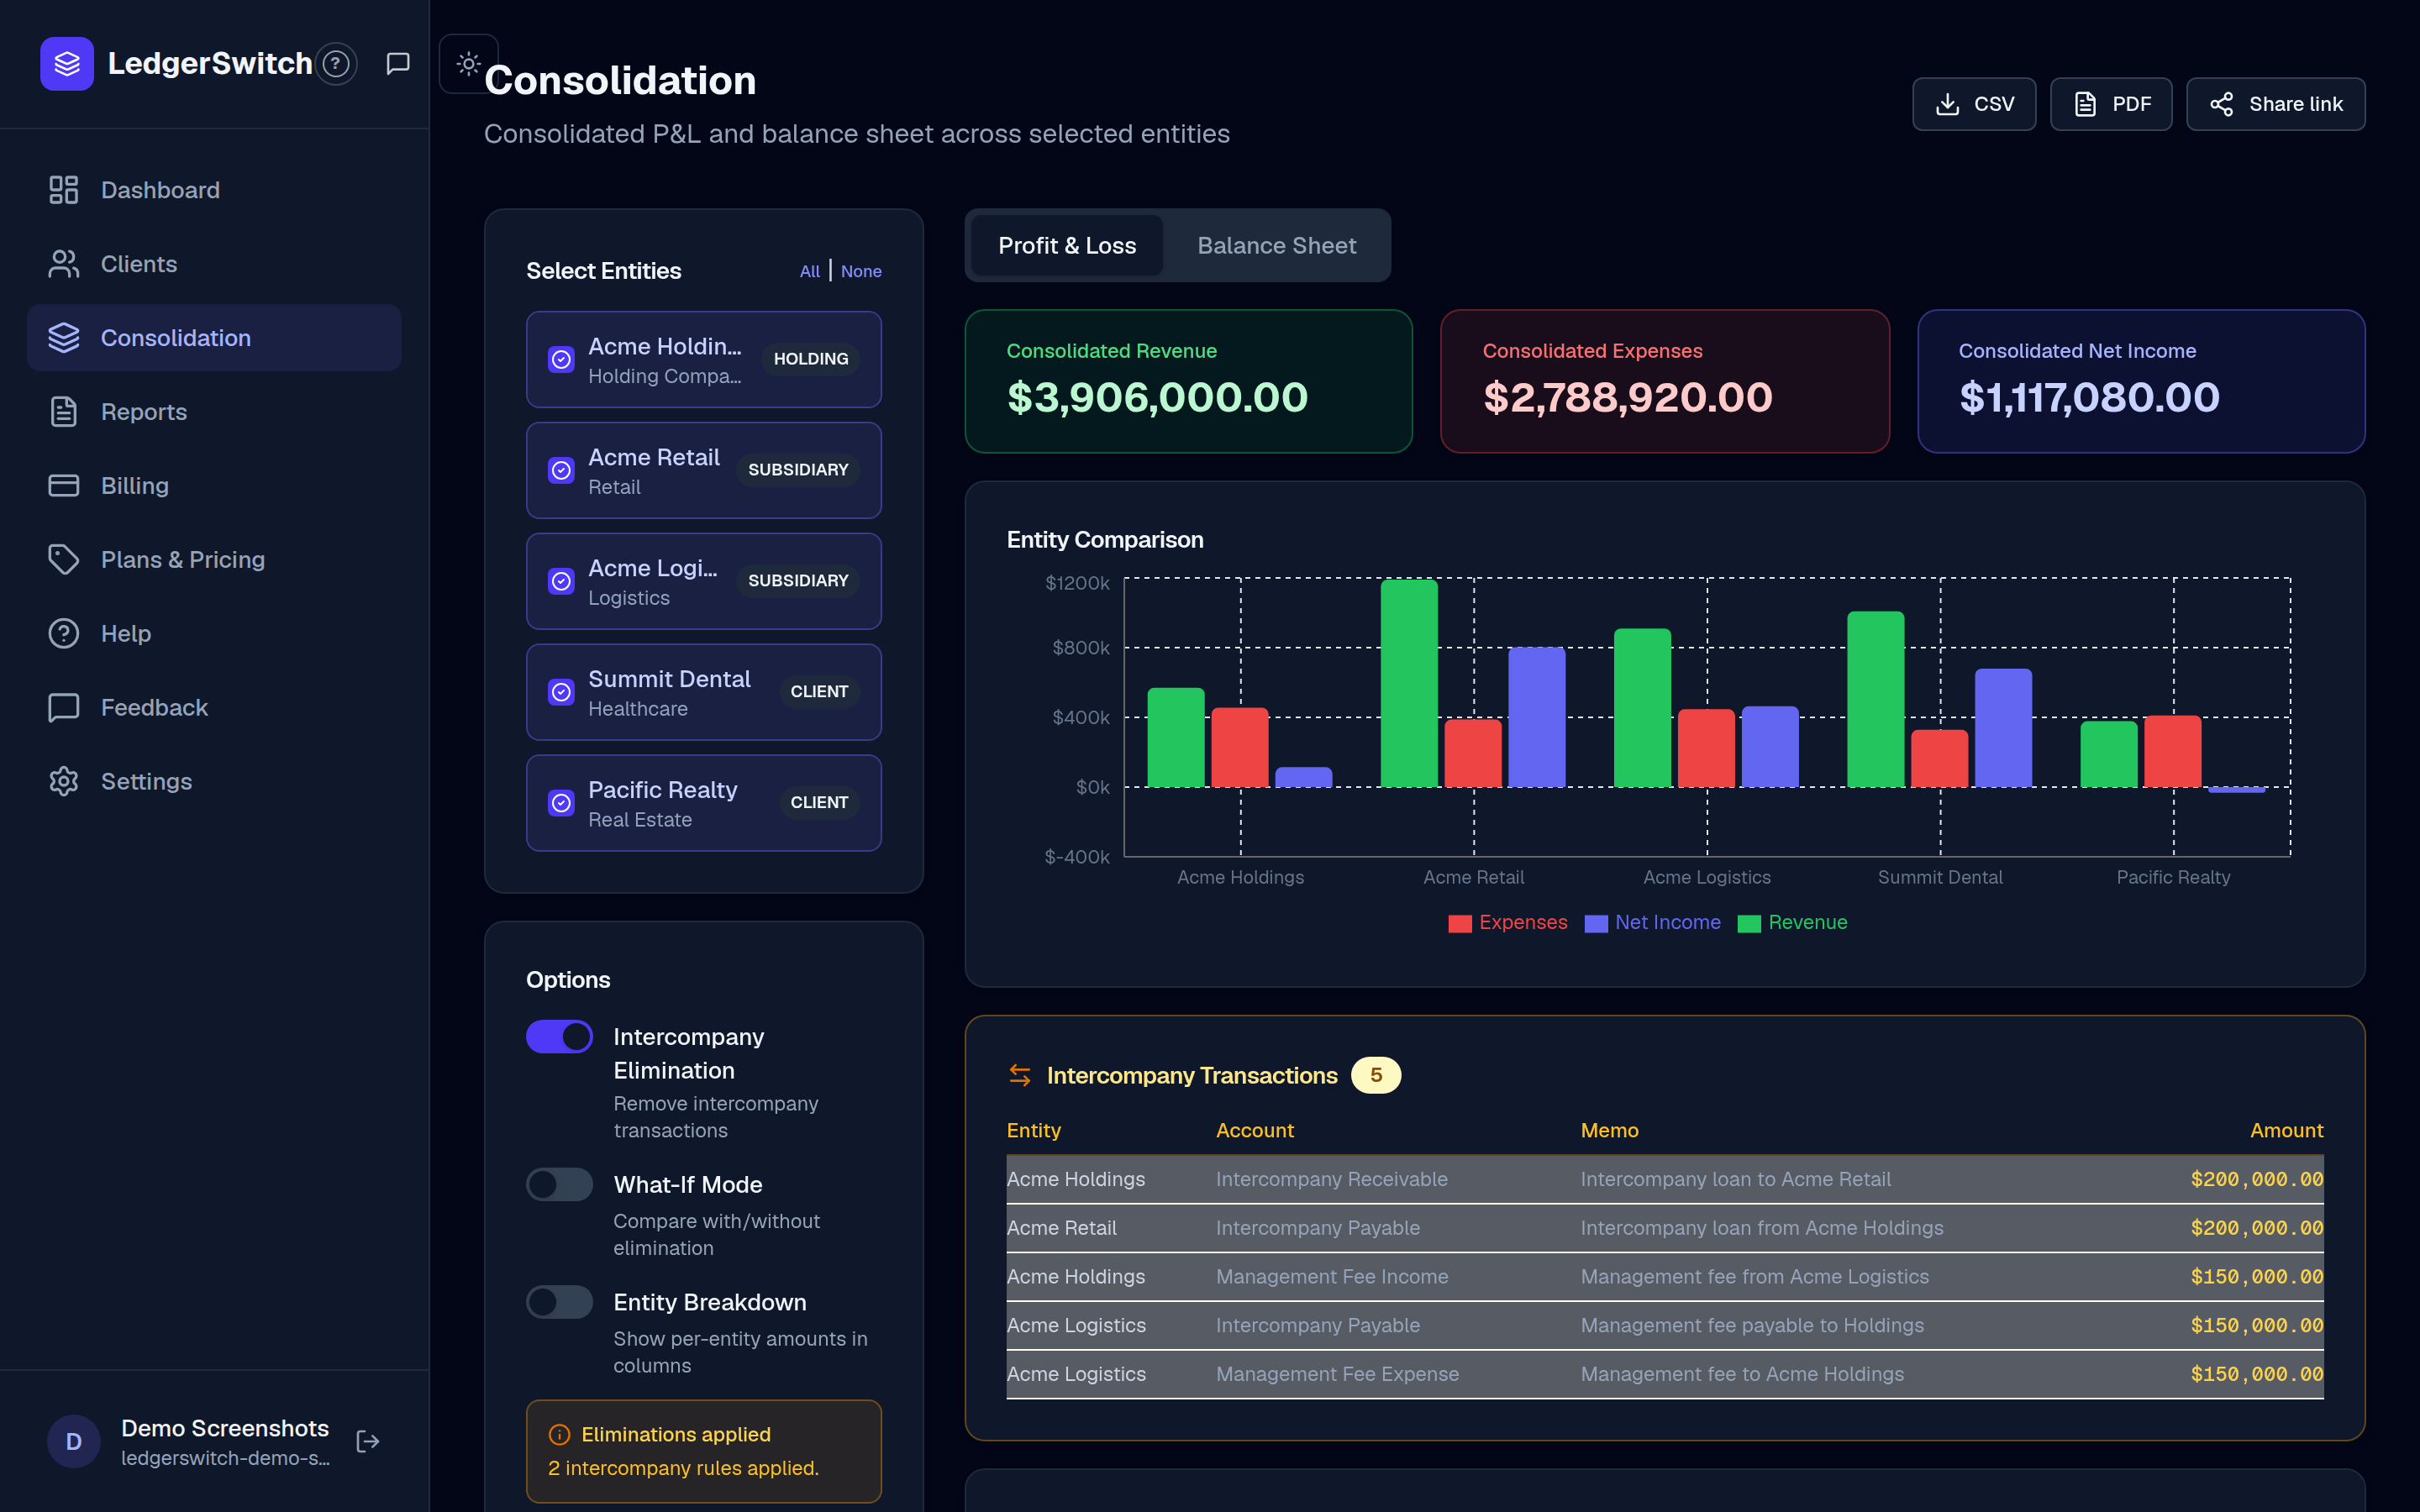
- Intercompany Elimination — when your companies pay each other (loans, management fees), that money appears twice in a simple total. This switch removes it so the group numbers aren't inflated. Eliminated lines are flagged in the report.
- What-If Mode — shows the report with and without eliminations side by side, including the dollar impact.
- Entity Breakdown — adds a column per company so you can see who contributes what to each line.
Elimination uses the intercompany rules attached to your data (the demo data includes two, so you can see it working). Accounts marked "Intercompany" in your CSV import are flagged for this purpose.
How do I build a custom report?
Open Reports. Pick a report type (P&L, Balance Sheet, or Trial Balance), tick the companies, choose a date range (presets like Year to Date, Last Month, Last Quarter — or custom dates), and click Generate Report.
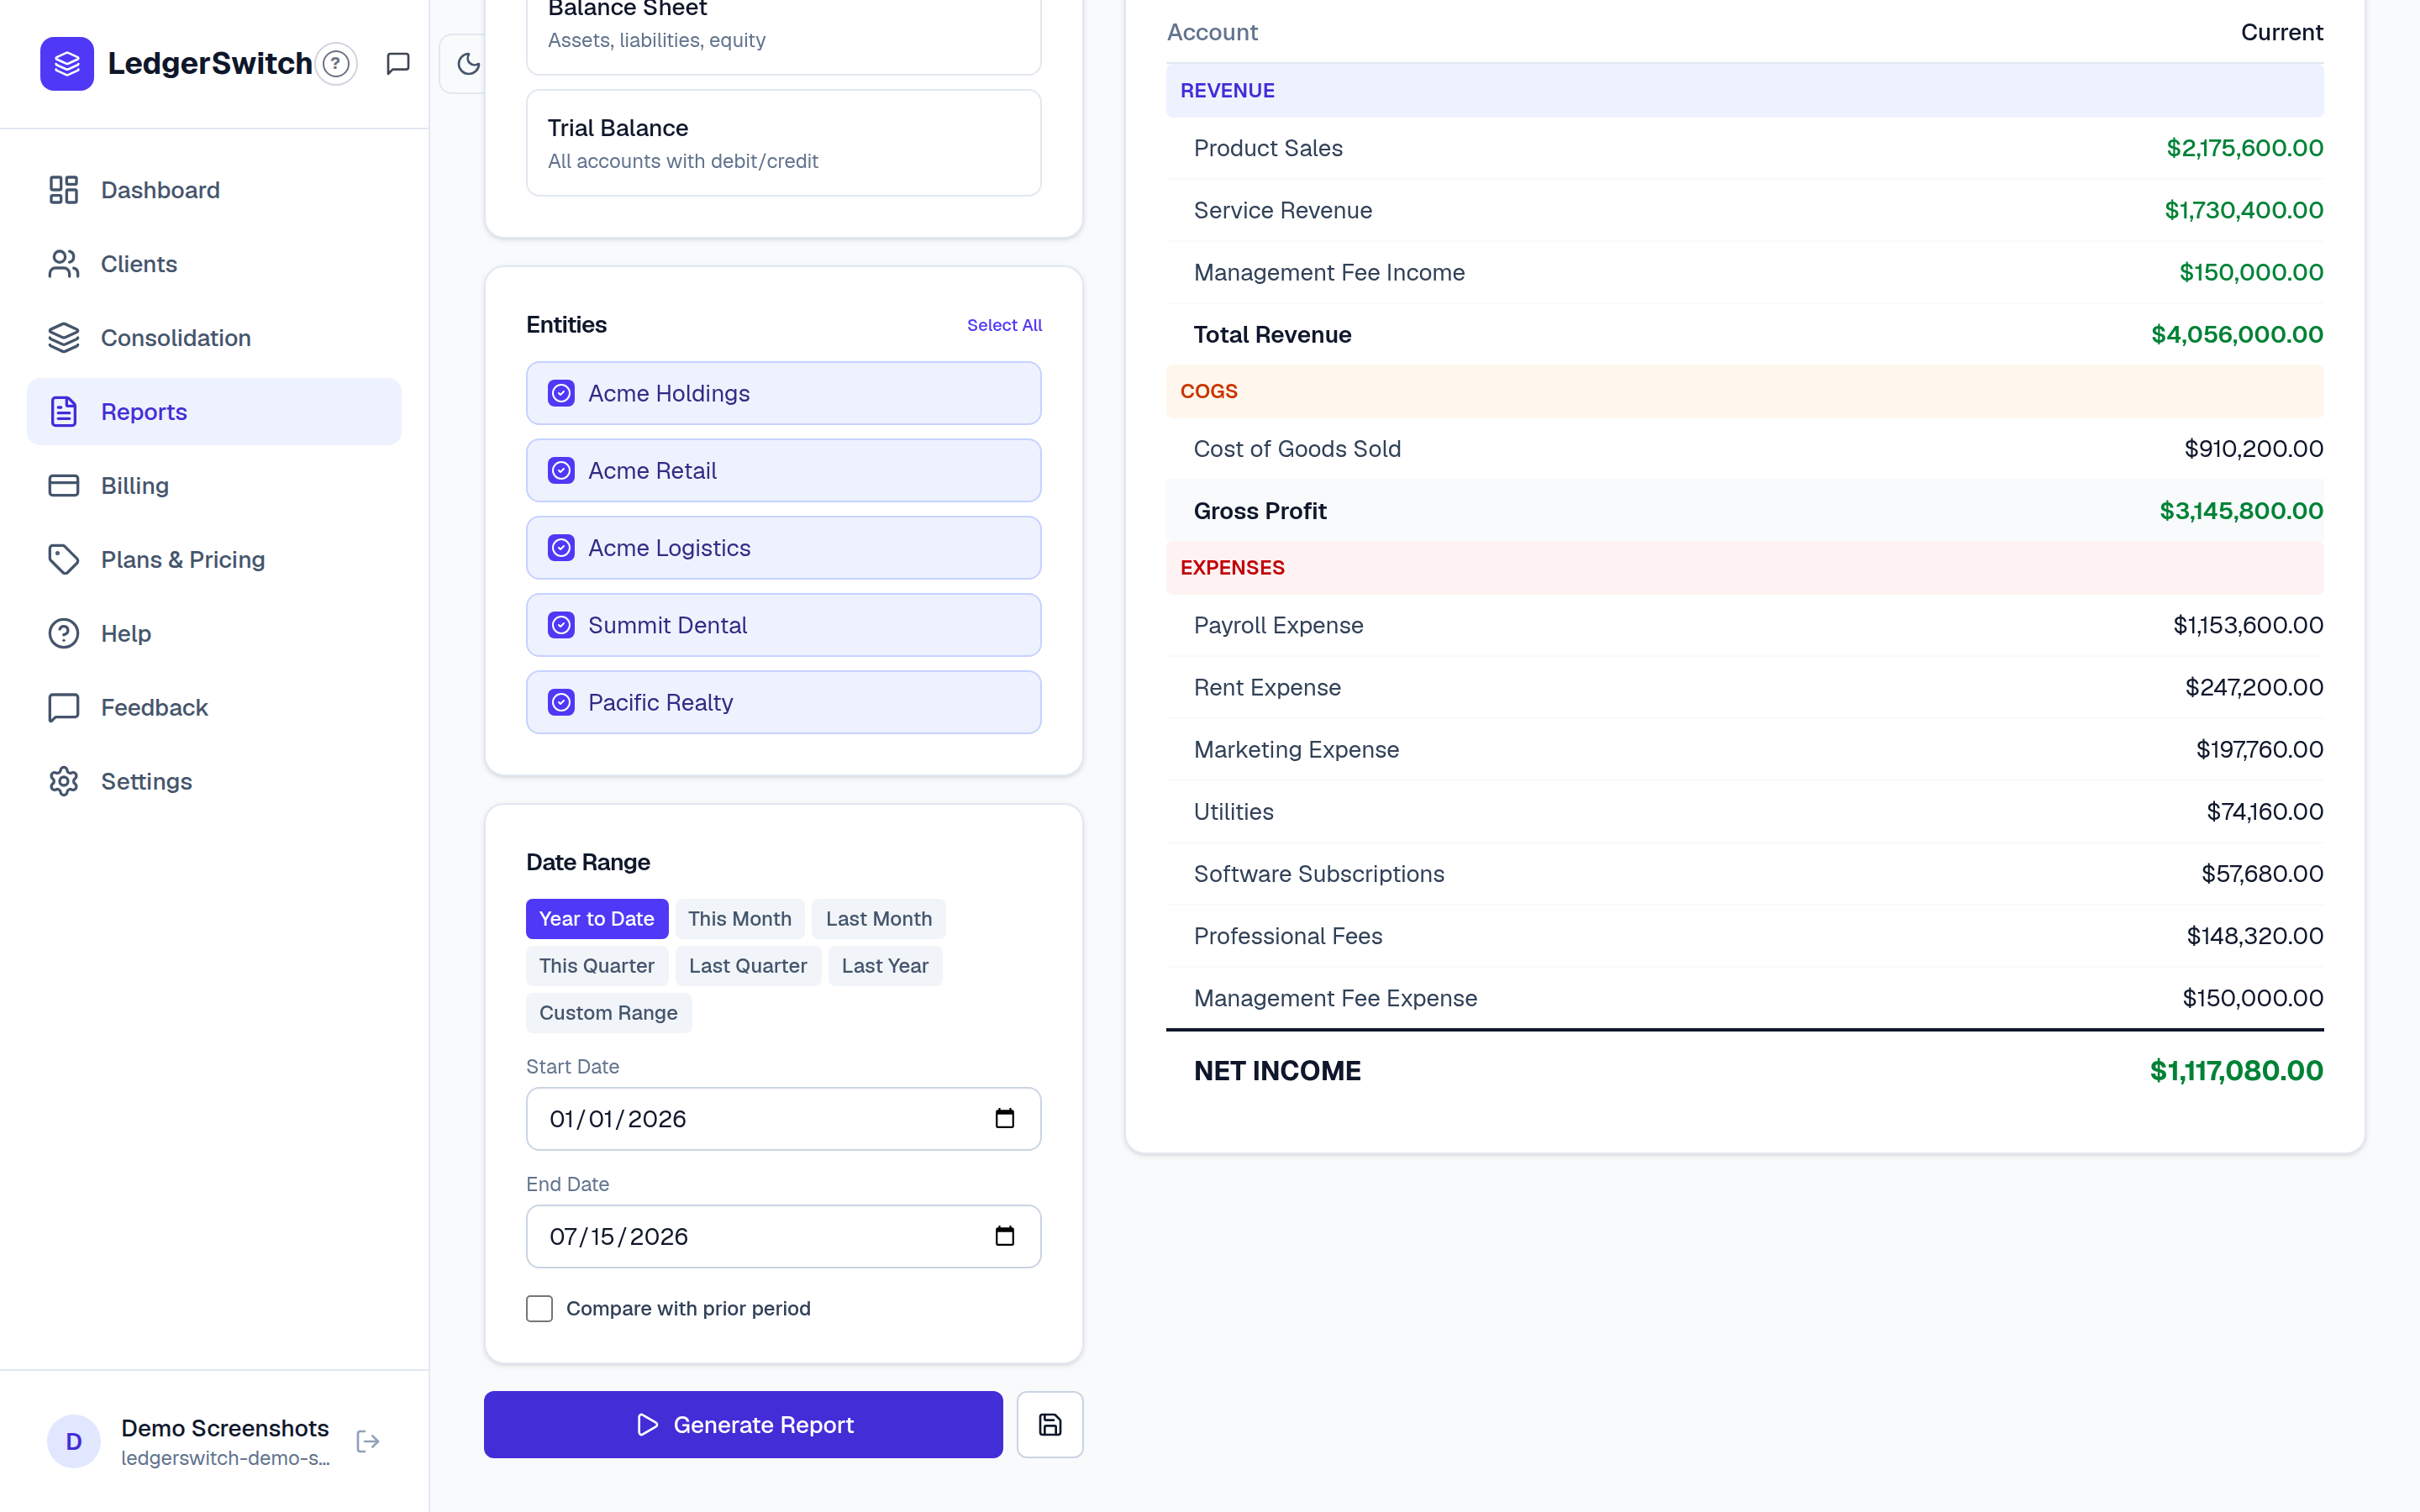
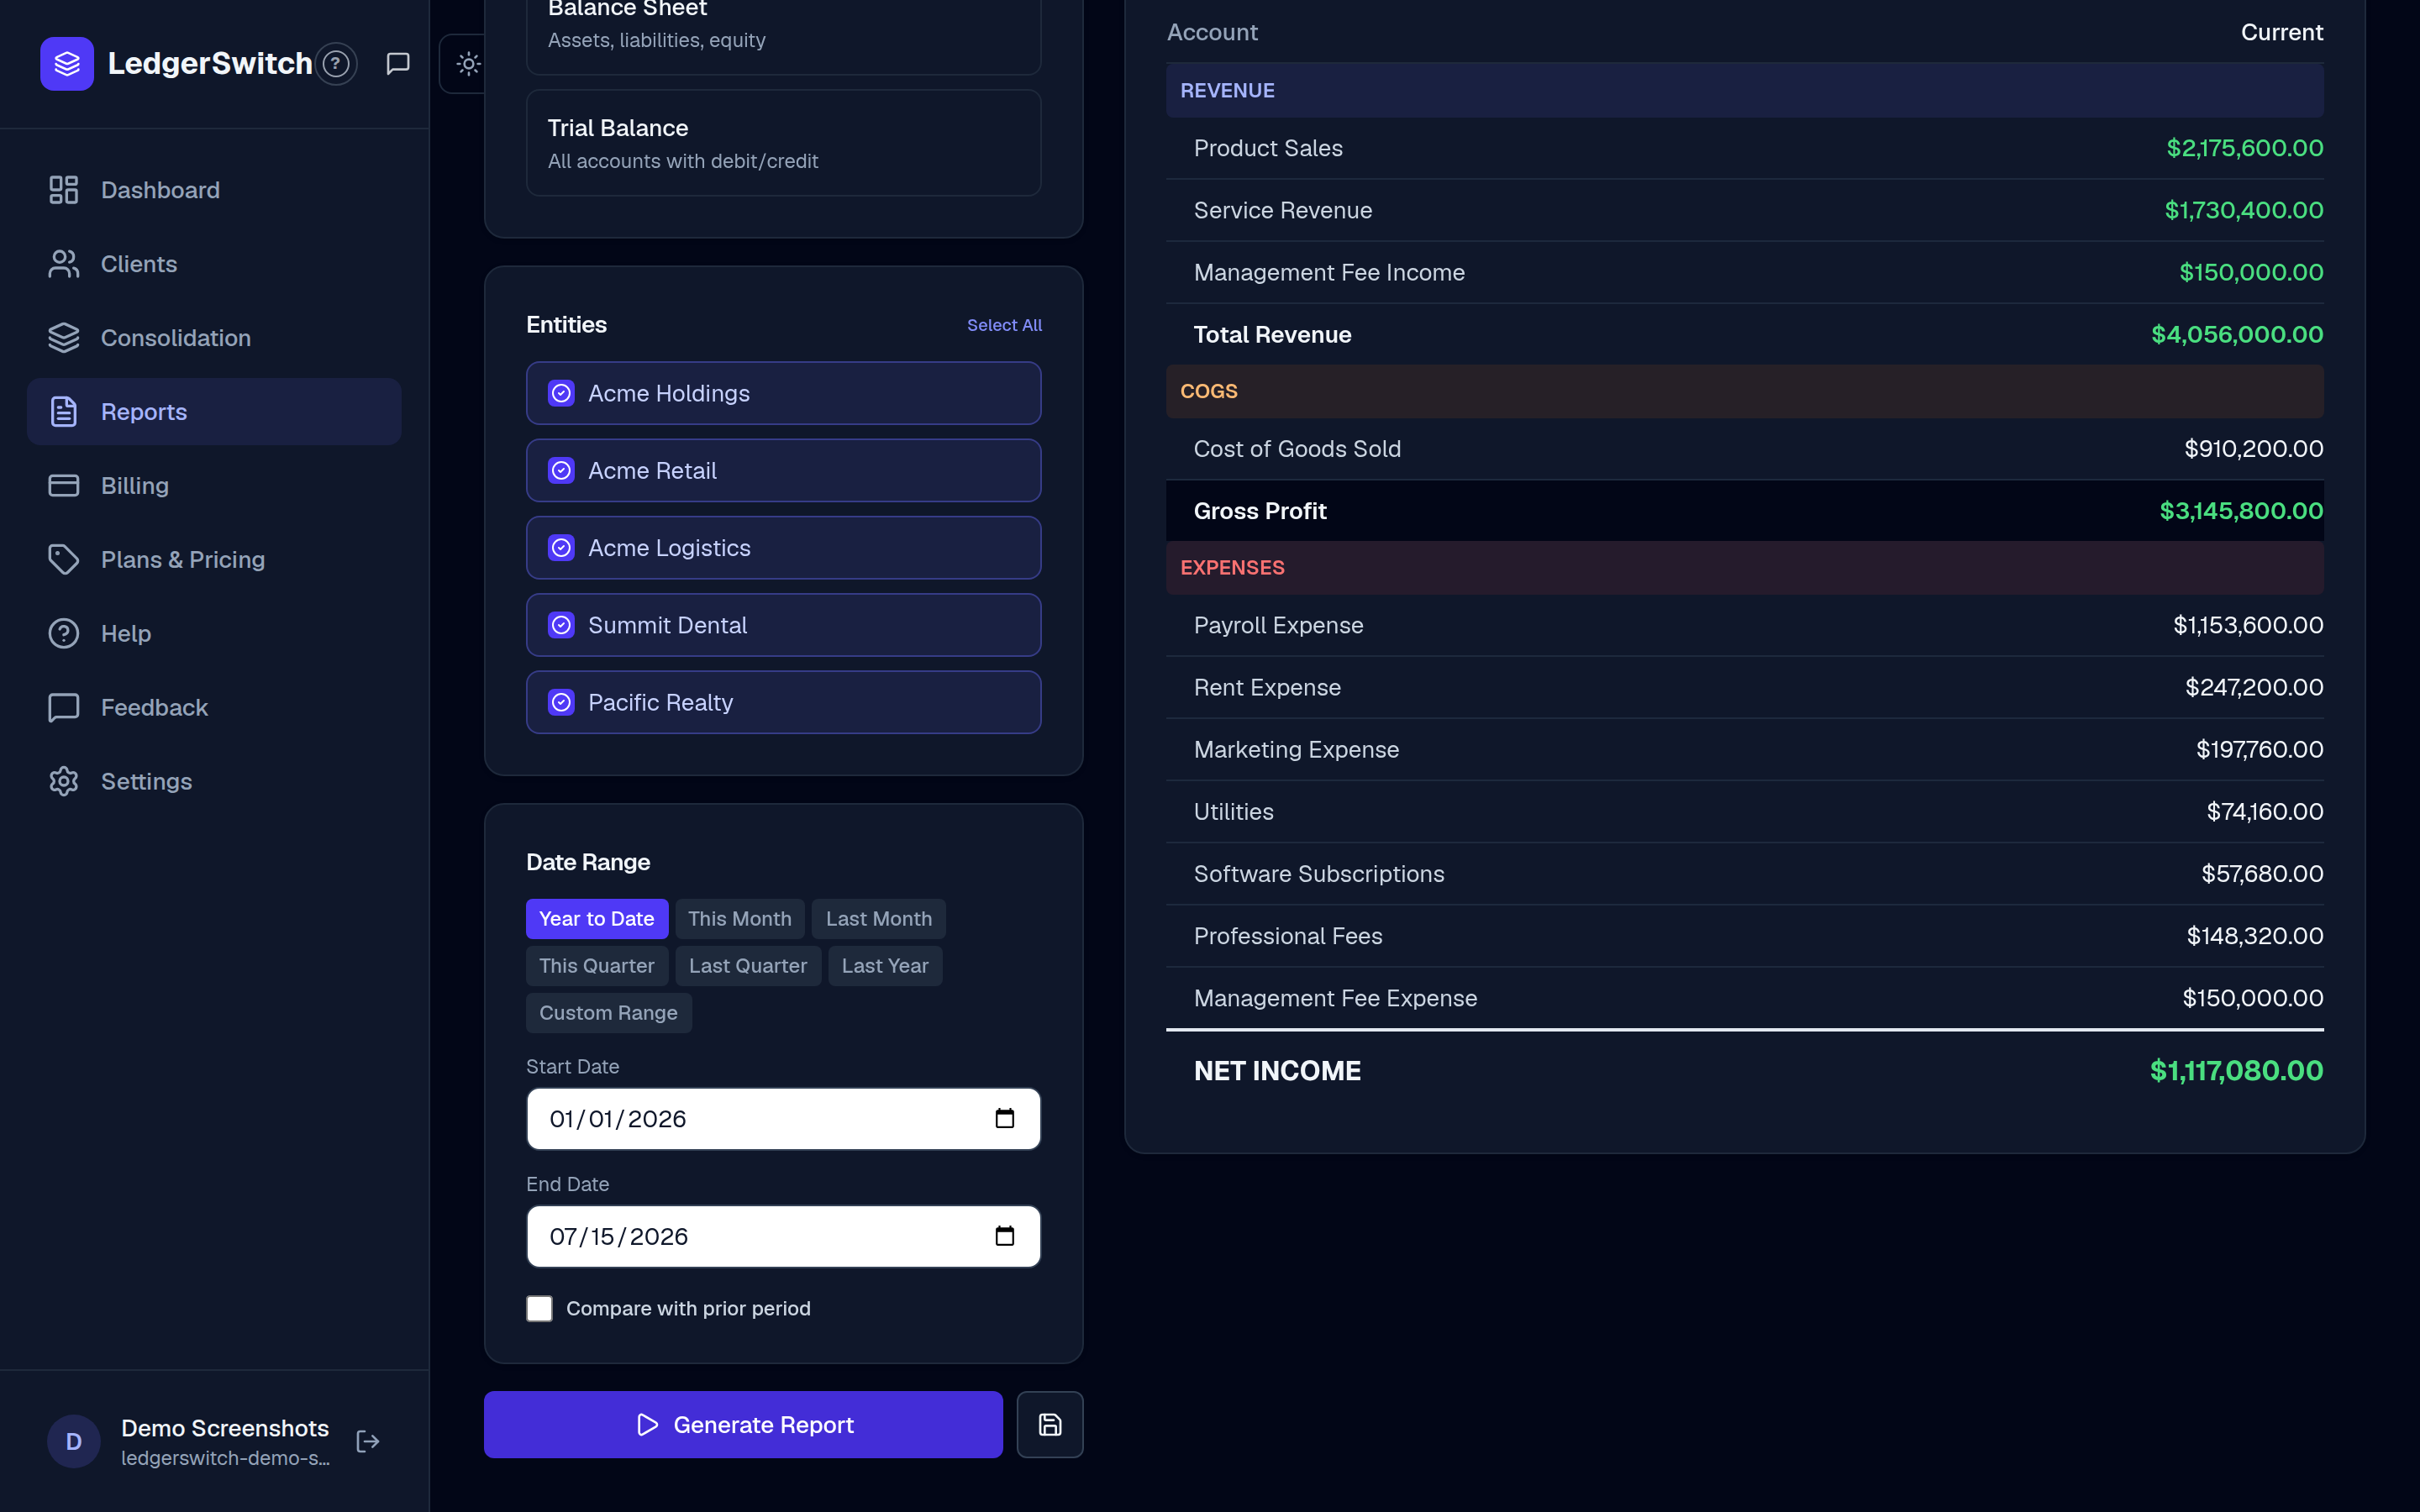
- Quick Templates (Monthly Close, Quarterly Review, …) fill in the setup with one click.
- Compare with prior period adds prior-period and change columns to P&L / Balance Sheet.
- The save button next to Generate stores your current setup as a personal template (kept in your browser).
How do I download a report?
Every report screen has CSV and PDF buttons. CSV opens in Excel or Google Sheets. PDF is a real, multi-page file with headers, subtotals, and page footers — ready to email or print, no browser print dialog involved.
How do I keep the numbers up to date?
Your reports reflect the most recent CSV you imported for each company. When a client's books change, export a fresh trial balance and Import CSV again — matching accounts are updated in place, nothing is duplicated.
Automatic QuickBooks Online sync (books refreshing on their own, on a schedule) is on the roadmap — the "Connect QBO" button will light up when it ships.
What does the ? button do?
The round ? button at the top of the sidebar turns on help mode. While it's on, small "?" markers appear next to the important buttons, numbers, and switches across the app — hover (or tap) one for a plain-language explanation of what it does. Click the button again to turn the markers off. Your choice is remembered on this device.
Plans, billing & cancelling
Bookkeeper — $99/mo: up to 10 client companies, +$9/month per extra client. Controller — $149/mo flat: up to 10 entities, includes consolidated reporting, eliminations, and shareable report links. Both start with a 14-day free trial, no card required.
On the Billing page, Manage Subscription opens the secure Stripe portal where you update your card, switch plans, view invoices, or cancel — LedgerSwitch never sees or stores your card number.
Using LedgerSwitch on your phone
The whole app works on a phone: the four most-used pages (Home, Clients, Consolidate, Reports) live in a tab bar at the bottom of the screen, and More opens the full menu — Billing, Help, Settings, and the rest.
LedgerSwitch — multi-entity consolidation for bookkeepers and controllers. Built by Martello Systems. Questions or something unclear? Use the Feedback page — it goes straight to us.